A 1,000m2 indoor entertainment venue gives you enough space to build a diverse attraction mix - but not enough space to install everything. The gap between those two facts is exactly where venue planning happens, and it is where most operators either build a profitable venue or quietly waste rented floor.
The challenge is not simply deciding which attractions to buy. The real question is how to allocate the available space so that large anchor attractions, compact experiences, customer circulation, social areas and supporting functions work together as one business instead of competing for the same square meters.
In this guide we build an illustrative 1,000m2 attraction mix around bowling, VR, golf, darts and interactive entertainment, and we use a revenue-per-square-meter model to explain why the mix matters more than any single attraction choice.
Most planning mistakes happen because operators argue about which attraction is "best" before they have agreed on a total picture. Start with the whole 1,000m2, then defend each share with a commercial reason. The table below is a worked example, not a universal template - your market will shift the numbers, but the structure holds.
| Zone | Example Area | Share |
|---|---|---|
| Bowling | 250m2 | 25% |
| VR Arena | 180m2 | 18% |
| Golf Simulator | 120m2 | 12% |
| Darts / Competitive Games | 60m2 | 6% |
| Interactive Games / LED | 100m2 | 10% |
| F&B / Social | 100m2 | 10% |
| Reception / Queue | 70m2 | 7% |
| Circulation / Service | 120m2 | 12% |
| Total | 1,000m2 | 100% |
This allocation already reflects a principle we return to throughout the article: space should follow commercial role, not personal preference. If you want the step-by-step method behind these numbers, see our guide on how to allocate 1,000m2 across bowling, VR, golf and interactive games. For the exact space each attraction needs in square meters, see how much space bowling, VR, golf, darts and interactive games require.
Every attraction in the plan above earns its square meters by playing a specific commercial role. When you plan by role, you stop asking "do we have a VR arena?" and start asking "what customer need does this zone serve, and what does it cost us in floor area?" That shift is what separates a list of machines from a venue strategy.
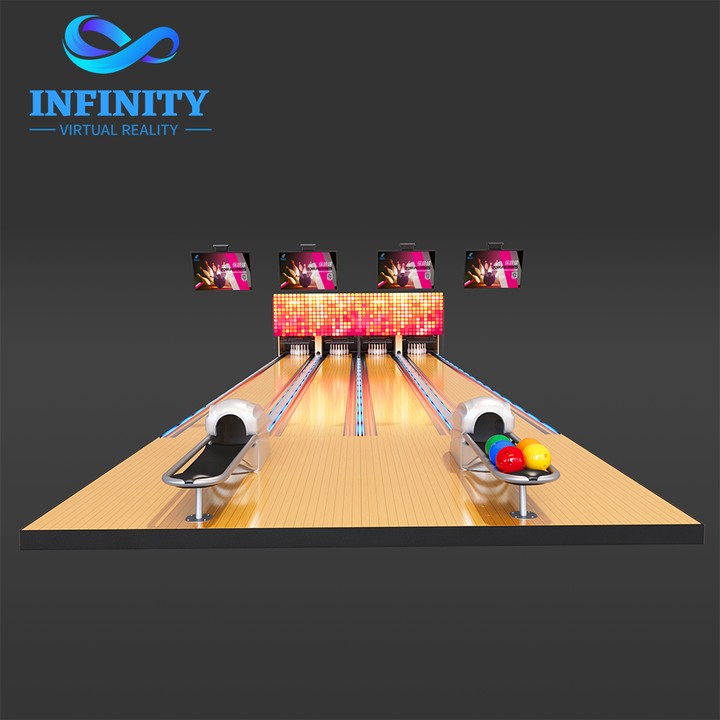
A commercial bowling equipment setup occupies the largest single block at about 250m2. Its commercial role is Anchor: it draws groups, supports longer sessions, appeals to families, and works for both corporate events and casual social play. An anchor is the reason a customer chooses your venue instead of staying home, and it gives the rest of the mix a reliable base of foot traffic.
The common mistake is judging bowling only by its footprint. Bowling should be evaluated by the customer capacity and dwell time it creates. A well-run bowling anchor keeps a lane group on site for 60 to 90 minutes, and that dwell time is what makes F&B, events and additional attraction spend possible. Footprint is an input; revenue per square meter is the output.
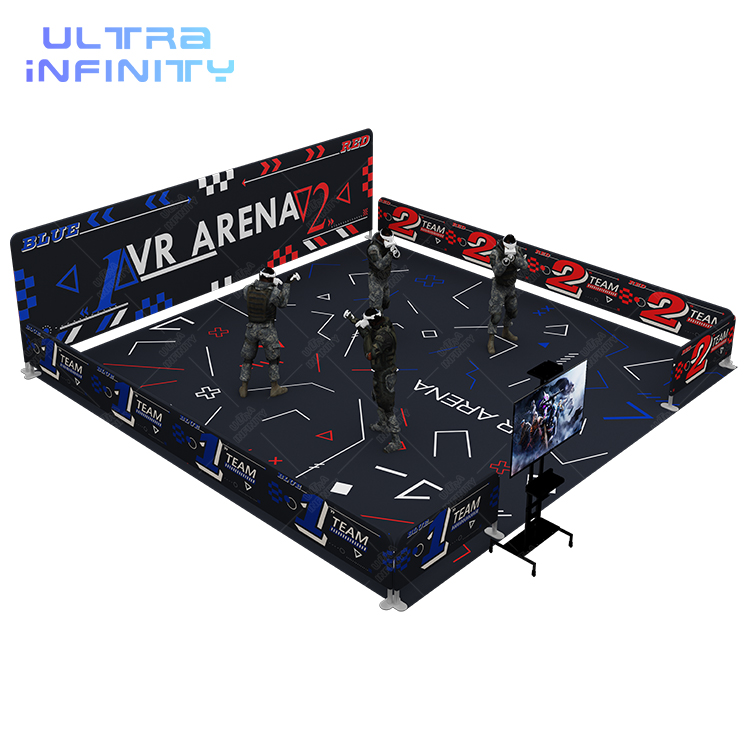
The VR Arena takes roughly 180m2 and plays the Immersive role. It targets teenagers, young adults and group play, and it delivers a competitive, photo-friendly experience that spreads on social media without heavy marketing spend.
VR is valuable precisely because it is different from bowling. It diversifies the venue instead of competing for exactly the same customer need. A family may come for bowling and stay for VR; a group of friends may come specifically for VR and add bowling on the same visit. Two attractions that serve different needs are worth more together than either alone.
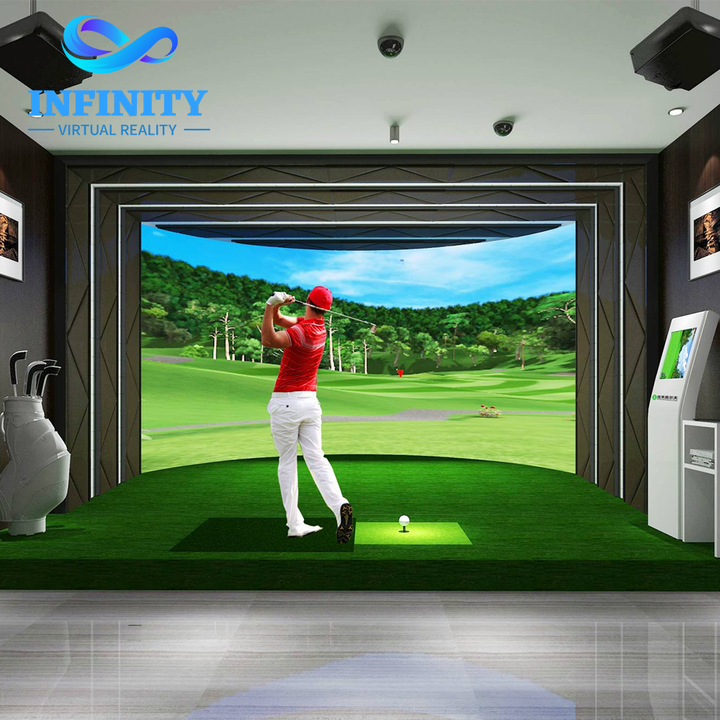
At about 120m2, a golf simulator plays the Sports role. It is especially suited to adults, sports enthusiasts, corporate clients and premium sessions where a higher price per hour is acceptable.
Golf adds a sports-oriented customer segment that bowling and VR do not fully reach, and it complements a broader sportainment concept where physical skill, competition and social play sit side by side. It also supports daytime corporate and membership use that fills hours large anchors alone cannot.
Darts needs only about 60m2 yet performs a special job: Social plus Compact. It does not consume floor like bowling, but it adds another paid experience and another reason for a group to extend its stay.
Darts is ideal for adults, groups, waiting areas and evening entertainment. A connected electronic darts machine placed near a bar or lounge turns dead waiting time into revenue and gives the venue a lower-cost, higher-margin social game that scales with demand. Few attractions return as much per square meter as a well-sited darts zone.
Interactive games and interactive LED floors take about 100m2 and play the Flexible or High-Activity role. Examples include grid games, interactive sports and compact digital games. They are the most adaptable part of the plan.
The key point is that not every revenue-generating experience needs a large dedicated room. Compact, flexible formats let you activate leftover space, corners and circulation edges. This idea is developed further in our guide on how to turn dead space into revenue, which focuses on small-footprint attractions for indoor venues.
A tempting shortcut is to split 1,000m2 into four equal 250m2 blocks: bowling, VR, golf and interactive. It feels fair, democratic and easy to explain. It is almost never the right commercial answer, because equality of area is not equality of value.
| Zone | Equal Share |
|---|---|
| Bowling | 250m2 |
| VR Arena | 250m2 |
| Golf Simulator | 250m2 |
| Interactive Games | 250m2 |
The equal split fails because attractions differ in footprint, capacity, session time, customer profile and revenue model. A 250m2 golf zone and a 250m2 bowling zone do not produce the same customer flow, the same dwell time or the same ancillary spend. Treating them as interchangeable squares of floor hides the real economics.
Before comparing mixes you need one metric everyone can use. Revenue per square meter is defined as monthly revenue divided by revenue-generating area. It answers a simple question: of the floor that actually earns money, how much income does each square meter produce?
| Metric | Example |
|---|---|
| Monthly Attraction Revenue | $60,000 |
| Revenue-Generating Area | 850m2 |
| Revenue per m2 / month | ~$70.6 |
If instead you divide by the full 1,000m2, the same revenue becomes $60/m2/month. That single choice of denominator changes how every attraction looks, which is why the next distinction between gross area and revenue-generating area matters so much for honest planning.
Gross venue area is the entire leased floor. Revenue-generating area is the part actually producing attraction income: the playable footprints of bowling, VR, golf, darts and interactive zones. Everything else is necessary but does not sell tickets directly.
The difference is consumed by reception, queue, circulation, F&B, storage, service, restrooms and staff areas. A venue that looks "1,000m2" on paper may only have 800 to 900m2 of truly productive space. Planning the mix against gross area hides this gap and quietly lowers your real revenue density, because you are dividing income by a number that is too large.
For a deeper model that separates productive and non-productive space, see our guide on how to maximize revenue per square meter in an indoor entertainment center.
Now build a complete venue model. The numbers below are illustrative; replace them with your own market data, and the structure will still hold. We use visitors per day rather than sessions per day because a 1,000m2 venue sells a whole experience, not a single attraction.
| Example Assumptions | Value |
|---|---|
| Venue Area | 1,000m2 |
| Visitors / Day | 250 |
| Average Attraction Spend | $18 |
| Additional Spend / Visitor | $4 |
| Operating Days | 26 |
Average spend per visitor is $18 plus $4, or $22. Daily revenue is 250 visitors times $22, or $5,500. Monthly revenue is $5,500 times 26 operating days, or $143,000. Revenue density is $143,000 divided by 1,000m2, or about $143/m2/month.
Assume a maximum daily capacity of 400 visitors. Utilization then drives the result far more than the attraction list does, because most fixed costs do not care how many people actually show up.
| Utilization | Visitors / Day | Illustrative Monthly Revenue |
|---|---|---|
| 30% | 120 | $68,640 |
| 40% | 160 | $91,520 |
| 50% | 200 | $114,400 |
| 60% | 240 | $137,280 |
| 70% | 280 | $160,160 |
Read the table carefully: attraction mix alone does not create revenue. Utilization creates revenue. A simpler mix at 70 percent utilization can out-earn a richer mix at 30 percent. This is why utilization work - pricing, groups, events and off-peak activation - belongs in the same conversation as equipment selection. More on density in our revenue-per-square-meter guide.
No single model is correct for every market. The "best" mix is the one that matches your customer base, location and investment capacity. Below are four common starting points; each changes the share of the same 1,000m2.
Best for a bowling-oriented market with strong group, adult and corporate demand. Typical mix: bowling plus darts, F&B and a small interactive zone. The anchor carries the business and the compact attractions raise spend per visit without adding much floor risk.
Best where families, kids and birthdays dominate. Typical mix: bowling plus interactive games, VR and a compact mini golf area. The priority is broad age coverage and birthday-party packages that lock in repeat, high-margin bookings.
Best for teens, adults and sports groups who want competition and skill. Typical mix: bowling plus golf, VR, darts and archery. This is the sportainment model, which you can explore as a complete indoor entertainment solution.
Best for young adults and gamers. Typical mix: VR Arena, VR simulators, interactive sports and darts. The venue leans digital and social rather than physical sport, which can lower staffing and raise throughput per square meter.
Some attractions should be highly visible from the entrance, while others can sit deeper where customers naturally continue their journey. Interactive and LED zones near the door create instant energy and trigger impulse purchases; the bowling anchor sits at the logical center; VR, golf and darts form the mid-depth journey; F&B and social close the loop before exit. Flow is not decoration - it is a revenue lever.
It is tempting to fill every meter with equipment. Resist it. You must reserve space for reception, queue, circulation, F&B, storage, service, restrooms and staff. These are not "wasted" - they are what makes the attractions productive and the visit comfortable enough to repeat.
A venue planned at 100 percent attraction density feels cramped, confuses flow and leaves no room for the social zones that lift average spend. The constraint is not how many machines fit; it is how many paying, comfortable, returning customers the space can serve.
Not necessarily. The best size depends on demand, investment capacity, location, target customers and the chosen attraction mix. A well-planned 500m2 venue can outperform a poorly planned 1,500m2 venue in both revenue density and utilization, because the smaller venue wastes less floor and converts a higher share of its traffic.
If you are weighing formats, our comparison of 500m2, 1,000m2 and 2,000m2 venue mixes shows how the right strategy scales with floor area rather than with the number of attractions.
Turn the model into your own numbers. Inputs: venue size, visitors per day, average spend, additional spend, operating days and utilization. Outputs: daily revenue, monthly revenue, annual revenue and revenue per square meter. The calculator makes the sensitivity table above interactive.
Enter venue size, visitors per day, average spend, additional spend, operating days and utilization to see daily, monthly and annual revenue plus revenue per square meter.
NextPlay designs complete venue solutions across 500m2, 1,000m2 and 2,000m2 plus formats, combining bowling, VR, golf, darts, interactive games and mini golf into one working revenue plan. Start from our complete indoor entertainment solution.
There is no single best mix. A role-based plan typically includes an anchor such as bowling, an immersive attraction such as VR, a sports attraction such as golf, a compact social attraction such as darts, flexible interactive games, plus F&B, reception, circulation and service space. The exact shares depend on your market and business model.
Attractions differ in footprint, capacity, session time, customer profile and revenue model. Equal area does not mean equal value. Planning by commercial role, not by equal squares of floor, produces a higher revenue per square meter.
Revenue per square meter equals monthly revenue divided by the revenue-generating area, not the full leased area. Using gross area instead of productive area understates your true density and hides inefficient space.
No. Utilization determines revenue as much as the mix. The same 1,000m2 venue can earn very different monthly revenue at 30 percent versus 70 percent utilization, so pricing, groups, events and off-peak activation matter as much as equipment choice.
Not necessarily. The right size depends on demand, budget, location, target customers and the chosen mix. A well-planned 500m2 venue can outperform a poorly planned 1,500m2 venue in revenue density and utilization.
Share your floor plan, location and preferred attractions. NextPlay can help you build an attraction mix, evaluate space allocation and develop a customized 3D venue layout.