Two indoor entertainment centers can occupy the same 1,000m2 and generate completely different levels of revenue. The difference is rarely explained by floor area alone. It comes from how effectively the venue converts available space into playable capacity, customer dwell time, repeat visits and additional spending. That is why revenue per square meter is one of the most useful metrics for evaluating an indoor entertainment venue.
The goal is not to fill every square meter with attractions. The goal is to make every productive square meter contribute to the customer experience and the business.
Revenue per square meter is calculated as:
| Metric | Example |
|---|---|
| Monthly Revenue | $80,000 |
| Revenue-generating area | 800m2 |
| Revenue per m2 / month | $100 |
Note the important distinction: revenue-generating area is not the full leased area. The full floor usually also includes reception, queue, circulation, storage, restrooms, staff areas, F&B back-of-house and technical rooms. So the real question is the gap between gross area and revenue-generating area, and how much of the productive area is actually working for you.
Operators often compare venues by total revenue, but that number hides space efficiency. Consider two venues:
| Venue | Area | Monthly Revenue | Revenue / m2 |
|---|---|---|---|
| Venue A | 1,000m2 | $80,000 | $80 |
| Venue B | 600m2 | $72,000 | $120 |
Venue A has higher total revenue, but Venue B is the more efficient operator. A larger venue should not automatically be considered a better-performing venue. The metric that matters is how much income each productive square meter produces.
Attractions play different commercial roles. Grouping them by footprint and function helps you plan space instead of guessing.
| Attraction | Space Demand | Capacity | Session | Commercial Role |
|---|---|---|---|---|
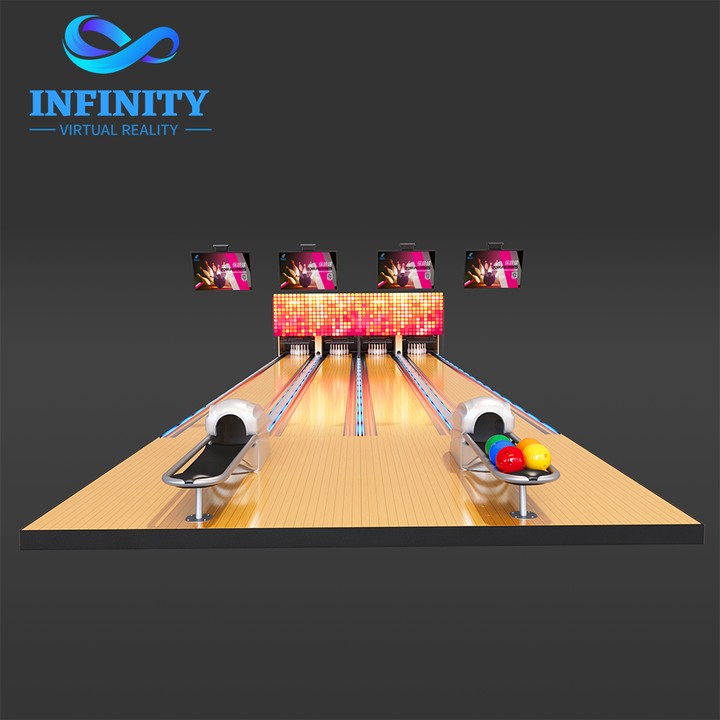
| Bowling | High | High | Medium | Anchor |
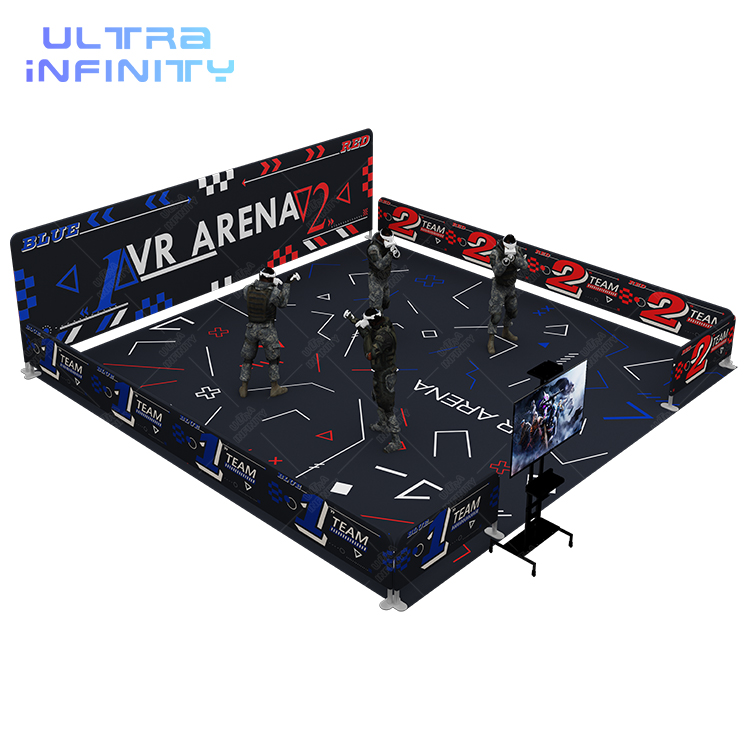
| VR Arena | Medium-High | Medium-High | Short-Medium | Immersive |
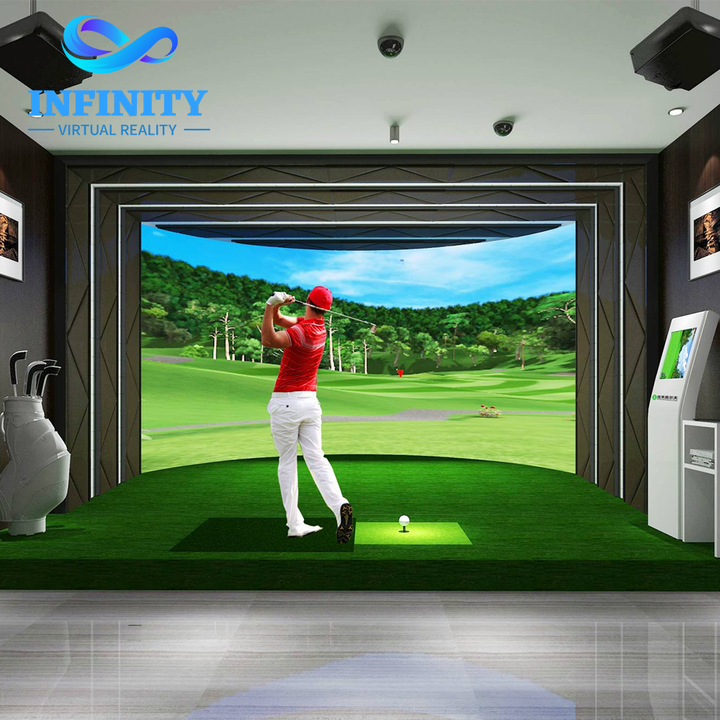
| Golf Simulator | Medium | Low-Medium | Medium | Sports |
| Darts | Low | Low-Medium | Short-Medium | Social |
| Interactive LED | Low | Medium | Short | Activation |
| Archery | Medium | Medium | Short-Medium | Competitive |
| Mini Golf | High | Medium | Medium | Family |
Avoid writing fixed space numbers unless you have the real engineering data for each product. The table above shows roles, not exact square meters. For the exact square-meter footprint of each attraction, see our space guide on how much space bowling, VR, golf, darts and interactive games require.
The first reflex of many operators is: space is tight, so buy more equipment. But the real problem is often that existing capacity is underused. Weekends may be full while weekday daytime sits near empty. The better question is how to activate the capacity you already have.
Common dead zones include entrance, waiting area, corridors, F&B corners, empty corners, former storage and small leftover spaces. The key question for each is not "can I fit a large machine?" but "can I fit a small, high-turnover, low-footprint experience?" See our guide how to turn dead space into revenue.
Compact options that match this need include darts, LED floor, grid light, interactive games, compact VR and digital shooting. These map closely to the NextPlay product structure.
Longer dwell time creates more opportunities for additional paid experiences, F&B and group spending. A single-attraction visit (bowling only) may last 30-60 minutes; a multi-attraction visit (bowling + VR + darts) can reach 90-120 minutes, generating more attraction spend, more F&B spend and a party or event opportunity.
Do not drop equipment into the room at random. Plan the path: entrance, visible attraction, reception, anchor attraction, supporting attraction, compact attraction, F&B or social zone, exit. Place visually stimulating attractions such as interactive LED, bowling and VR near the entrance to trigger purchases. Put darts or interactive games in waiting areas so waiting time earns revenue. Keep F&B next to social attractions to extend stays.
| Customer | Suitable Attractions |
|---|---|
| Kids | Interactive Games / Mini Golf |
| Teens | VR / Darts / Bowling |
| Adults | Golf / Darts / Bowling |
| Families | Bowling / Mini Golf / Interactive |
| Corporate | Bowling / Golf / Darts / VR |
| Competitive Players | VR / Archery / Shooting / Darts |
Designing for several segments means the venue does not over-rely on one type of customer.
Revenue can be split into attraction revenue, F&B, party packages, events, merchandise and memberships. Revenue per square meter is influenced by both space utilization and average customer spend. This is where the article moves from pure space efficiency to the whole business model.
Monthly Revenue = Players x Average Spend x Operating Days x Utilization
Revenue per m2 = Monthly Revenue / Revenue-Generating Area
Revenue Potential = Capacity x Price x Utilization x Operating Days / Productive Area
Plug your own numbers into this model. The output is not a fixed benchmark but a way to test how capacity, price, utilization and productive area interact.
The right strategy scales with floor area. See the comparison in our guide 500m2 vs. 1,000m2 vs. 2,000m2 venue mix.
| Venue | Main Strategy |
|---|---|
| 500m2 | High-density attractions |
| 1,000m2 | Balanced attraction mix |
| 2,000m2 | Multiple revenue zones |
| 5,000m2 | Destination entertainment |
500m2 aims to maximize density; 1,000m2 balances capacity and variety; 2,000m2 builds multiple revenue streams; 5,000m2 becomes a destination.
Scenario A uses bowling, VR, F&B and a large open circulation area, leaving too much low-productivity space. Scenario B adds darts, interactive LED, a golf simulator and compact VR, and monetizes queues. The objective is to create more revenue-generating touchpoints without simply adding more large attractions. We do not claim a specific percentage uplift without a real case study.
| Scenario | Makeup | Result |
|---|---|---|
| A | Bowling + VR + F&B + open circulation | Too much low-productivity space |
| B | A + Darts + LED + Golf + Compact VR + queue monetization | More capacity, more choice, more cross-selling |
NextPlay designs full venue solutions across 500m2, 1,000m2 and 2,000m2 plus formats, combining bowling, VR, golf, darts, archery, interactive games and mini golf into one working revenue plan. Start from our complete indoor entertainment solution.
It is monthly revenue divided by the revenue-generating area, not the full leased area. It shows how efficiently the productive space produces income.
A larger venue can post higher total revenue while using space less efficiently than a smaller one. Revenue per square meter reveals the real performance.
Improve the attraction mix, raise utilization in off-peak hours, monetize dead space with compact attractions, extend dwell time, design customer flow and build packages that lift average spend.
Darts, interactive LED floors, grid light, compact VR, digital shooting and small interactive games deliver quick turnover on very little floor area.
500m2 should maximize density, 1,000m2 should balance capacity and variety, 2,000m2 should build multiple revenue zones, and 5,000m2 should aim to become a destination entertainment venue.
Share your floor plan, venue size and preferred attractions. NextPlay can help you evaluate the attraction mix, space allocation and revenue potential of your indoor entertainment venue.