An indoor entertainment center can have hundreds or even thousands of square meters of space, yet not every square meter contributes to revenue. The gap between rented floor area and revenue-generating floor area is where most venues quietly lose money every single month.
Most operators pay close attention to rent, major attractions, ticket pricing, food and beverage, and marketing. Those are important. What often gets ignored is the metric that ties them all together: revenue per square meter. When that metric is low, the symptom usually shows up as dead space.
Dead space is any area in your venue that does not pull its weight. It does not generate income, it does not increase foot traffic, it does not increase spending, and in some cases it even disrupts customer flow. The mistake is treating it as a layout problem to tolerate. Instead of seeing unused areas as a layout problem, operators can treat them as revenue opportunities.
Dead space is not a single thing. It appears in three forms, and recognizing the difference changes how you fix it.
This is space that is genuinely empty. Examples include empty corners, wide corridors, and unused wall areas. Nothing happens there, and customers simply walk past.
This space sees people, but it earns nothing. Waiting areas, transition zones and queue areas are the classic examples. Customers stand there, but the venue captures no revenue from that time.
This is the most overlooked form. The area has something in it, but the return is poor. Imagine a 30m2 zone earning $500 per month, while a 10m2 attraction next to it earns $2,000 per month. The 30m2 zone is, in commercial terms, also dead space.
The cost of dead space is easiest to see through revenue per square meter. The formula is simple:
Revenue per Square Meter = Revenue Generated / Occupied Area
| Example Zone | Area | Monthly Revenue | Revenue / m2 |
|---|---|---|---|
| Before optimization | 20m2 | $1,000 | $50 |
| After optimization | 20m2 | $3,000 | $150 |
In this illustrative example, the same 20m2 goes from $50/m2/month to $150/m2/month, a 200 percent improvement, without adding a single square meter of rented floor. The example is illustrative, not an industry standard, but the direction is the point: dead space is rent you pay for nothing.
Turn the concept into a working tool. Walk your venue and audit every zone with these questions:
| Space Audit Question | Your Answer |
|---|---|
| Is this area unused for most of the day? | Yes / No |
| Does it generate direct revenue? | Yes / No |
| Does it contribute to customer engagement? | Yes / No |
| Is customer traffic passing through it? | Yes / No |
| Can a compact attraction fit here? | Yes / No |
| Can customers understand the attraction quickly? | Yes / No |
The zones worth fixing first are easy to rank. Map every area on two axes - traffic and revenue:
| Low Revenue | High Revenue | |
|---|---|---|
| High Traffic | Priority to Optimize | Keep |
| Low Traffic | Consider Redesign | Optimize |
A high-traffic, low-revenue zone is the hottest opportunity in the building. Customers are already there; you are simply not monetizing their presence. This two-by-two model can later become a proper infographic for your planning process.
The core rule is that different spaces require different attraction types. A compact dart lane and a full bowling anchor solve completely different spatial problems.
Best served by darts, arcade machines, interactive games, small VR attractions, reaction games and prize games. The principle is small footprint plus quick gameplay plus high turnover.
These areas lack depth, so choose interactive wall games, digital sports, interactive lighting and reaction games. They need wall or floor contact, not a large footprint.
The goal is to turn waiting time into paid play time. Darts, mini games, interactive games and small arcade attractions fit naturally and lift spend while customers wait.
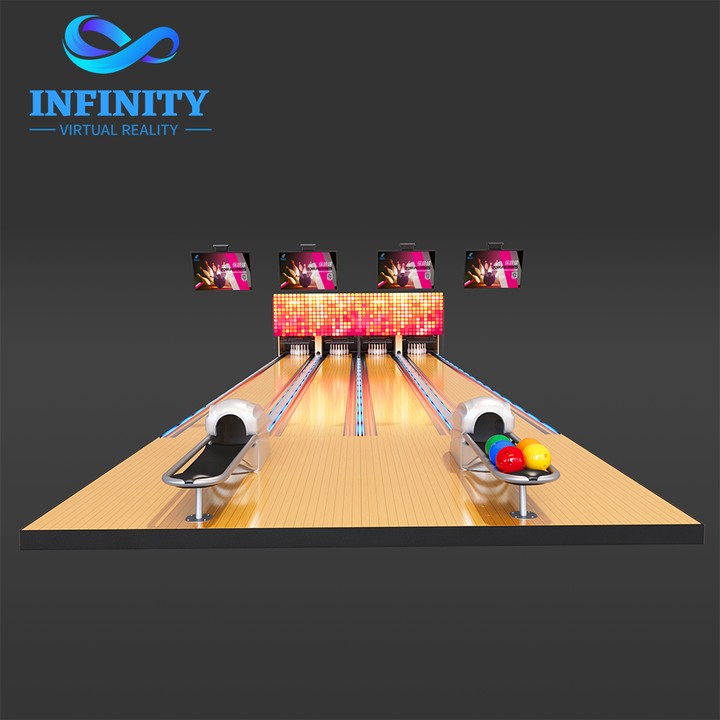
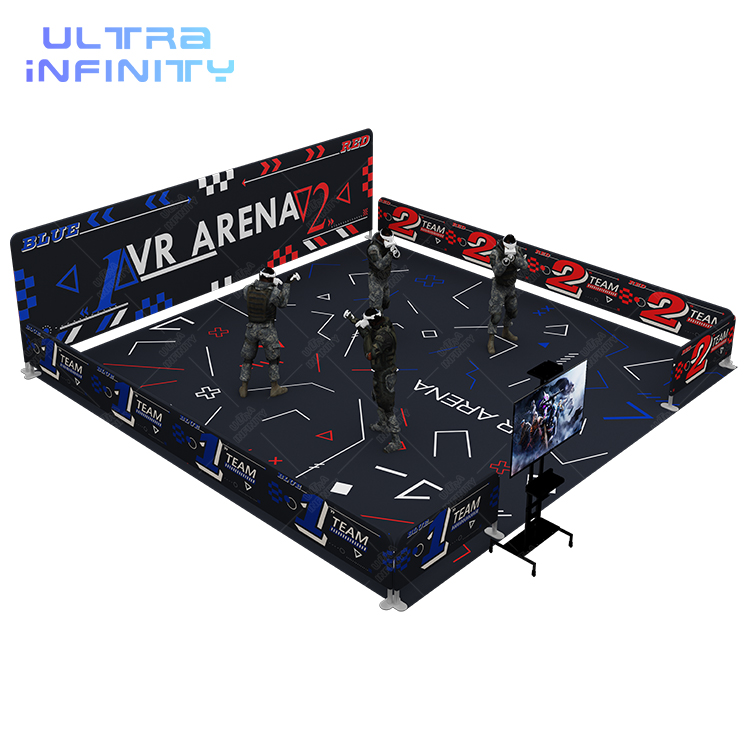
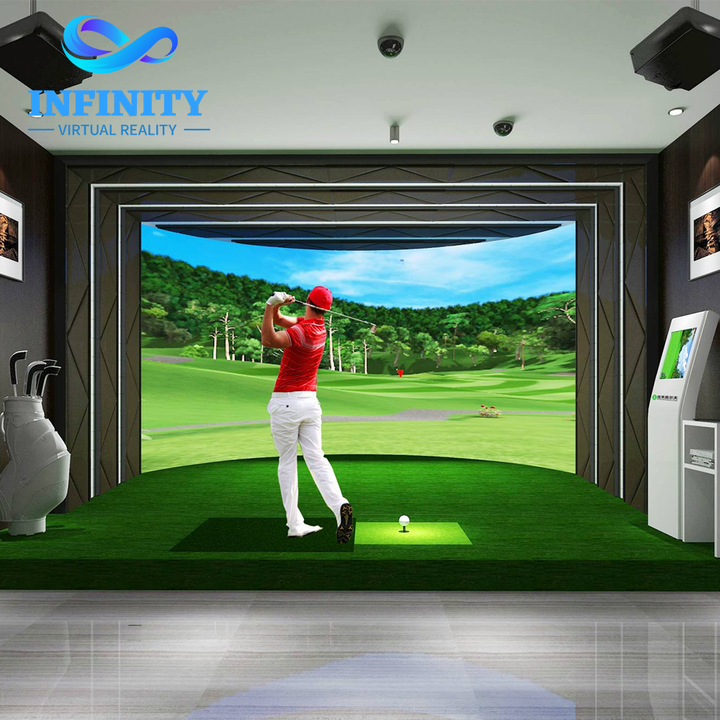
If the space is genuinely large, it can host bowling, mini golf, a VR Arena, sports simulators or multi-player attractions. This is where the broader NextPlay product system becomes relevant. For the exact square-meter footprint each of these attractions requires, see our guide on how much space a bowling alley, VR arena, golf simulator and darts area need.
Darts offer a small footprint, easy installation, social gameplay and high repeatability. Few attractions return as much per square meter as a well-sited darts zone near a bar or lounge.
Arcade machines suit corners, waiting zones and transition areas. They monetize exactly the low-utilization spaces that otherwise earn nothing.
Simulators for golf, baseball, shooting and archery fit customers who want short-duration activities. They deliver a sports experience without the footprint of a full court or field.
Mini golf works well in irregular or underutilized areas and solves three things at once: space use, family entertainment and social play. It is a strong answer for larger dead zones.
VR delivers high entertainment value without requiring the footprint of traditional large attractions. That sentence captures why VR fits dead-space strategy so well for NextPlay venues.
Be honest: not every dead space suits bowling. It needs sufficient ceiling height, lane length, player circulation, seating and equipment area. So the rule is large space to bowling, not forcing bowling into a small corner. This honesty makes the plan credible.
Interactive floors suit unused floor area, children zones, transition zones and flexible event areas. They align closely with the NextPlay interactive product range and activate space that is otherwise flat and idle.
Space utilization is not the same as cramming in equipment. The wrong move is "put a machine wherever there is a gap." The right move is to design attractions around space, traffic, customer age and spending pattern.
Evaluate every candidate on six dimensions before buying:
Before installing anything, estimate the upside with a simple model:
Estimated Revenue = Players per Hour x Average Price per Play x Operating Hours x Utilization Rate x Days per Month
| Assumption | Value |
|---|---|
| Players per hour | 4 |
| Average price per play | $8 |
| Operating hours per day | 8 |
| Utilization rate | 50% |
| Days per month | 30 |
Calculation: 4 x $8 x 8 x 50 percent x 30 = $3,840 per month from a compact installation. This is a simplified example, not a guaranteed result, but it gives operators a way to compare options before committing capital.
The logic is easier to trust with concrete before-and-after pictures.
Before: a 20m2 empty corner. After: darts plus arcade. Result: a new revenue-generating zone that also improves the energy of the surrounding area.
Before: customers waiting for their main activity. After: interactive games on the wall and a small arcade. Result: waiting time becomes paid entertainment time instead of lost time.
Before: low utilization across a bigger zone. After: mini golf or a VR Arena. Result: a new attraction and a longer customer stay, which lifts total spend.
Dead-space optimization is not only about direct income from a small machine. It creates indirect value that compounds:
This is a more sophisticated argument than "equipment earns money," and it is what separates a venue strategy from a equipment list.
The article can become a customer decision path. NextPlay frames the work in seven steps:
For the attraction-mix step, see our guide on the best attraction mix for a 1,000m2 venue, and for the revenue-method step see how to maximize revenue per square meter. The full allocation method is covered in how to allocate 1,000m2 across bowling, VR, golf and interactive games.
Have an unused corner, waiting area, or underperforming zone in your venue? Do not treat it as wasted floor. Share your floor plan, available space, or project requirements with our team. We can help you explore attraction combinations designed around your available space, customer flow, and business goals. For a broader look at turning space into income, start from our revenue-per-square-meter guide, and for a complete venue solution see NextPlay sportainment.
Dead space is any area that does not contribute to revenue. It can be physically empty, low-utilization such as a waiting area, or underperforming where installed equipment earns far less per square meter than it should.
Use revenue per square meter: revenue generated divided by occupied area. Comparing the same zone before and after optimization shows how much income is being left on the floor.
Compact, high-turnover options work best: darts, arcade machines, interactive games, interactive floors, small VR attractions, reaction games and short-duration sports simulators such as golf or archery.
No. Space utilization is not the same as cramming in machines. Match each attraction to space, traffic, customer age and spending pattern, and estimate revenue potential before buying.
Multiply players per hour by average price per play by operating hours by utilization rate by days per month. This gives an illustrative monthly revenue figure to compare options.
Share your floor plan, available space, or project requirements with our team. We can help you explore attraction combinations designed around your available space, customer flow, and business goals.