Multi-sport simulator vs single-sport gear, put through six tests on one floor meter: revenue per square meter, dwell, audience breadth, content and staff cost, training depth and payback - with the published measured scale, the vendor payback bands and a buy-multi / buy-single / run-both decision tree.
The multi-sport simulator vs single-sport gear decision is a procurement question wearing a hardware question as a coat. Both options claim the same floor meter, both sell sessions by the hour, and only one of them fits the calendar you actually have. This guide answers it the way a revenue test should: six tests on one meter - revenue per square meter, dwell and throughput, audience breadth against training depth, content and staff complexity, capex and payback, and what happens when the trend moves - then a decision tree that closes with buy multi, buy single, or run both. Every internal figure below is a published NextPlay number, and every external band is attributed to its source on first use.
Archetype one is the multi-sport box: one screen, one impact mat, one sensor stack, and a library of sports sitting behind it. According to JAMMA's multi-sport buying guide (2025-11-22), a commercial multi-sport machine runs $18,000-60,000 with the screen, mat and sensors included, takes 12-25 square meters of floor, and turns 20-40 guests an hour. The JAMMA multi-sport vs single-sport comparison (2025-11-24) widens the field to $10,000-70,000 for multi-sport against $15,000-150,000-plus for single-sport, dwell of 30-60 minutes against 60-120 minutes, and return on investment of 6-24 months against 9-36 months. Those are vendor-reported bands: a frame for the conversation, not a promise for the spreadsheet.
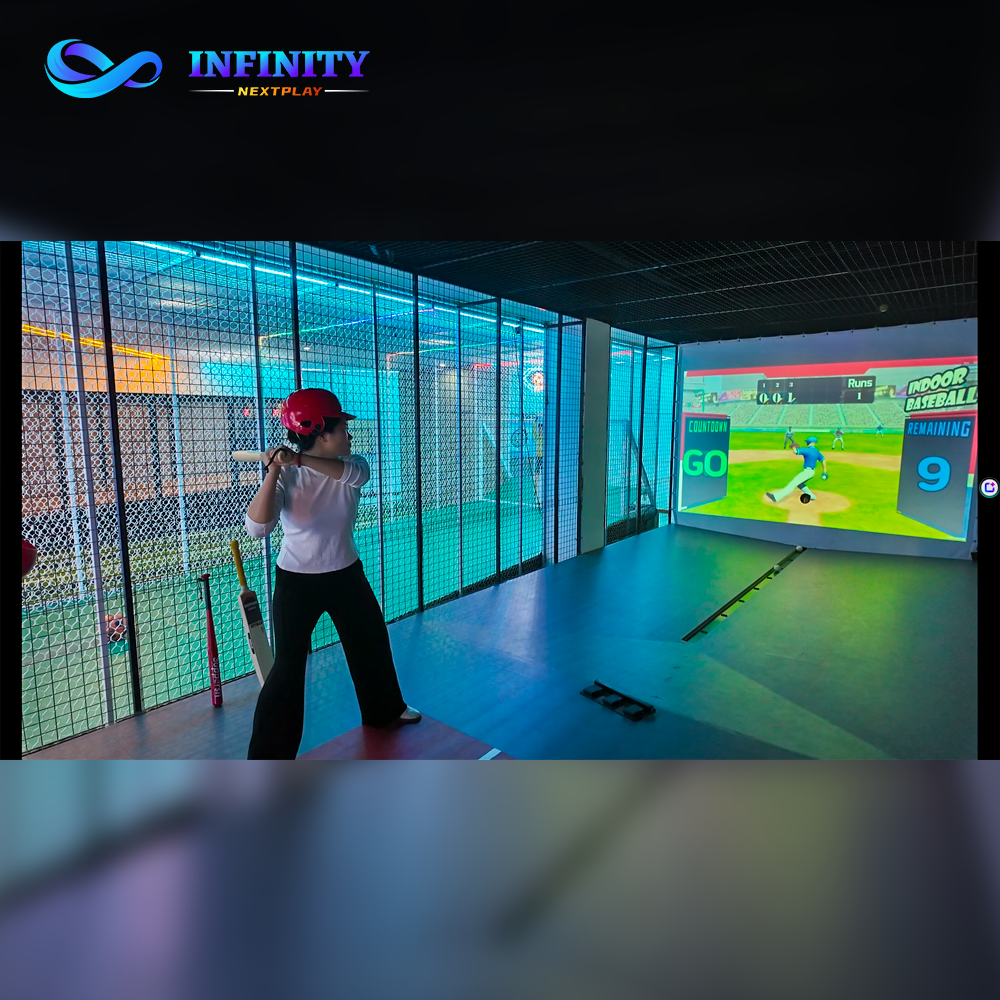
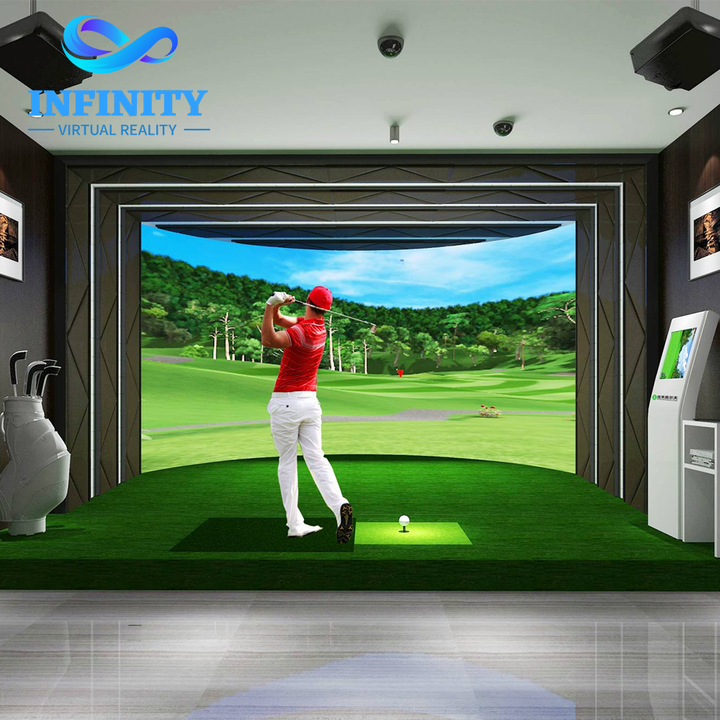
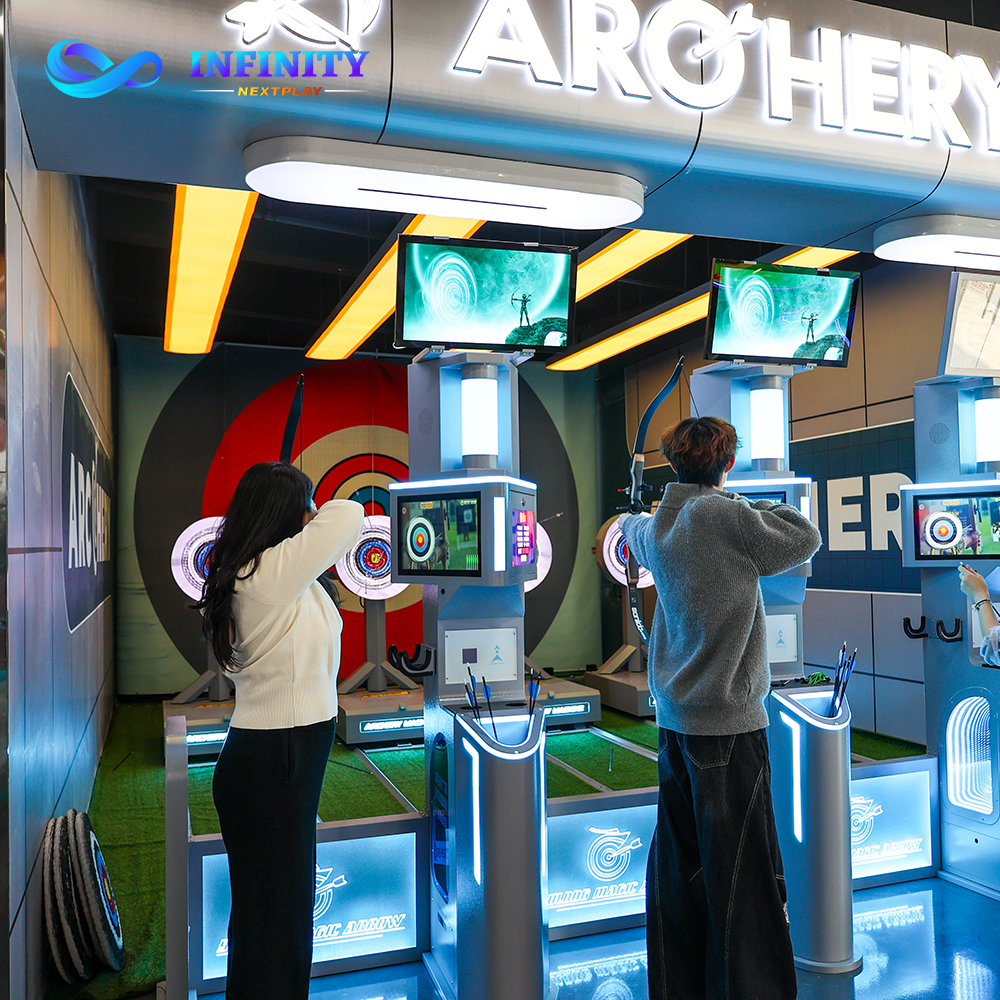
Archetype two is the dedicated machine: one sport, built deep. A batting simulator that tracks the real ball, an AR golf bay with a high-speed camera detector, an archery lane with an adjustable track distance - each buys a fidelity the rate card can price. Depth has numbers behind it: Tabski's platform data puts a golf bay at a steady-state $95,000-115,000 a year at 36% utilization and $55 an hour, and our own published anchor books $2,800-6,100 a month for a two-lane archery corner across the 30-70% utilization band with breakeven at about 36%. Depth is also what the measured per-square-meter table in Test 1 is built from: no dedicated format in our published scale is missing a line.
The only fair judge of a purchase is the meter it stands on: revenue per square meter per month, at a stated utilization. Multi-sport simulator revenue per square meter is the number every buyer asks for and almost nobody publishes with a measurement attached, so this test starts from the scale our own cluster has already published - one row per format, one confidence label per row, and no unit conversions invented to make the ranking come out right.
| Format (published anchor) | Basis | Measured value | Confidence |
|---|---|---|---|
| Archery lane, two-lane corner | $/m2/month at 68% utilization | About $960/m2/mo | Verified - published NP cluster |
| Shooting lane | $/m2/month at 62% utilization | About $460/m2/mo | Verified - published NP cluster |
| VR arena | $/m2/month | $320/m2/mo | Verified - published NP post |
| Baseball bay, nets included | $/m2/month | About $160/m2/mo | Verified - published NP cluster |
| 1,000 m2 eight-zone center | $/m2/month, average across zones | About $143/m2/mo | Verified - published NP cluster |
| Darts corner | $/month per corner | About $1,400/mo | Verified - published NP cluster |
| Duckpin lane / golf bay | $/hour of operation | $45/hr and about $38/hr | Verified - published NP cluster |
| Mini golf (first-party example) | $12 ticket x 120 guests x 26 days | $37,440/mo | First-party worked example |
| Multi-sport bay | Classified by its lead sport | 12-25 m2 machine footprint | Vendor-reported - JAMMA |
Read the table as a ranking, not a scoreboard. Dedicated formats earn their meter: the archery lane at about $960 per square meter per month and the shooting lane at about $460 sit at the top of the published scale, while a baseball bay sits near $160 because its nets and safety envelope bill floor space that never sells a session. The multi-sport machine does not appear as its own line - on this scale it is judged as whatever sport it leads with, plus the 12-25 square meters JAMMA reports for the box. That is the argument in one sentence: the multi-sport question is never answered on the unit, it is answered on the mix. Our own cluster makes the same point format by format in the which sports simulator yields more revenue comparison, the mini golf vs arcade per-square-meter comparison and the two VR arenas vs a row of shooters, which wins per meter - three published head-to-heads in which the winner changes with the format and with the floor.
Assumptions, stated: the chart plots the monthly per-square-meter rows at the utilization each was published at, and the per-hour rows (duckpin $45, golf bay about $38) stay in the table as rates rather than being converted into monthlies - a conversion nobody has measured would be a new number, and there are none of those in this piece. What the scale cannot tell you is how fast the meter fills, which is Test 2. What it does tell you is that one simulator or multiple machines is not settled by density alone: a multi-sport box earns its floor by turning it, a dedicated lane earns its floor by pricing it, and the mixed center earns the average of both.
One more floor fact, because every per-square-meter figure is measured against the part of the room that plays: the published space rule-of-thumb gives 60% of the area to play, 20% to circulation, 15% to support and 5% to the queue, and the industry layout guide behind it notes that 25-35% of a total footprint goes to reception, walkways, queues and back-of-house. The play share is the denominator of Test 1, so a machine that needs more non-playing clearance spends part of its meter before it earns anything on it.
The second test is speed: how long a guest stays, and how many guests the machine absorbs in an open hour. According to JAMMA's multi-sport vs single-sport comparison, dwell runs 30-60 minutes on a multi-sport bay against 60-120 minutes on single-sport gear, and throughput runs 20-40 guests an hour against 10-20. A second JAMMA figure frames the single-sport envelope at 10-20 square meters per bay including clearance, with a 45-90 minute dwell - the same story told in floor space instead of minutes.
| Measure | Multi-sport simulator | Single-sport gear | Source |
|---|---|---|---|
| Dwell per visit | 30-60 minutes | 60-120 minutes | JAMMA head-to-head (vendor-reported) |
| Throughput, guests per open hour | 20-40 | 10-20 | JAMMA buying guide (vendor-reported) |
| Footprint | 12-25 m2 for the machine | 10-20 m2 per bay, clearance in | JAMMA (vendor-reported) |
| Single-bay dwell reference | Not published separately | 45-90 minutes | JAMMA ROI paper (vendor-reported) |
| Published session pace we quote | Not applicable | Archery: 16-24 guests per lane-hour | Verified - published NP cluster |
Worked math, labeled as an EXAMPLE: at the band midpoints a multi-sport bay turns about 30 guests an open hour and a single-sport bay about 15 - two to one in guest turns - which over a ten-hour trading day is 300 turns against 150. Turns are not revenue, and the difference shows in our own published anchors: the archery lane books 16-24 guests per lane-hour on a $12-20 fifteen-minute session, so the rate per turn and the length of the turn decide which throughput figure reaches the register. A fast machine on a cheap turn and a slow machine on an expensive one can finish the month in either order.
What dwell buys, and what rotation buys. A longer visit is a visit that can carry food and beverage, and the benchmark cited by Tabski from an NGF survey of 354 operators is about $0.73 of food-and-beverage spend for every $1.00 of bay revenue. The shorter multi-sport visit answers with rotation instead of menu: more guests per open hour means the queue does the work the bar does on the deep format. That is also why the two formats rarely compete for the same ticket - one sells an evening, the other sells a turn - and why a mixed floor can price them differently without the price list looking broken.
Breadth is a queue argument. A multi-sport box lets a family, a corporate group and a walk-in each play a different game without moving a chair, and the layout research published by YULONG reports that the mix itself extends the visit: three or more machine types rotating on a floor are associated with 40-60% longer guest dwell, and machines placed in the first 10-15 meters from the entrance draw 30-50% more play than the same machines placed deeper in the room. Both figures are vendor-reported, and both point at the same operating truth - on a small floor with mixed traffic, one simulator or multiple machines stops being a hardware question and becomes a question about who walks in.
Depth is a rate-card argument. Single-sport gear is what leagues, coaching programs and repeat training are built on, and the price of depth is published: Tabski's platform data puts the median at $55 per hour in operating stores, with a separate $40 listing median across an interquartile range of $25-55 - two different measures, never blended into one number. The same source puts steady-state golf-bay revenue at $95,000-115,000 a year at 36% utilization, and it draws the lifeline underneath: below about 25% annual utilization a staffed four-bay venue cannot cover its fixed costs, while first-year utilization averages about 33%. Depth pays when the calendar is real, and bleeds when the calendar is a hope.
When to buy a single-sport simulator, in one test: name the weekday demand out loud. If the answer is a league night, a coaching roster or a training account, buy the depth - that is the audience Test 3 is describing, and it books by reservation rather than by walk-in. If the answer is a mix of families and drop-ins who have never held a club, a bat or a bow, buy the breadth and let Test 5's capex band decide how much of it you can afford before the calendar has proved anything either way.
Multi-sport gear is a content business wearing hardware. The machine ships with a sport library, the library grows by software update, and the floor can offer something new without a delivery note - which is the whole future-proofing case for the multi-sport archetype: the sport that is fashionable in three years can be added to the machine you already own, while the deeper formats age on hardware and the hardware ages as a purchase order. The add-on prices show how cheap a content refresh is when it is not free: a TruGolf MultiSport ARCADE pack of 14 games is listed at $4,500-5,000, an aboutGOLF Multisport sensor starts at $3,500, and a whole integrated 60-plus-sport machine is listed at $29,950 (vendor price lists).
Single-sport gear takes the opposite position: the depth is the product. A new measurement mode, a better ball-tracking camera or a truer putting surface arrives as a hardware generation, and a hardware generation arrives as a purchase order. That is not a defect - it is where the fidelity the rate card charges for comes from - but it means the single-sport owner refreshes on the manufacturer's cycle while the multi-sport owner refreshes on the content calendar. The two budgets look nothing alike five years in, even when the entry prices looked close on the day.
Staff complexity runs the same direction. One multi-sport machine is one layout to explain, one set of safety rules and one operator facing a queue of guests who are playing four different games; a row of single-sport machines is a row of specialisms - the archery lane's range rules and scoring, the batting simulator's ball tracking, the golf bay's camera calibration. Neither is harder in itself and neither is free: the difference shows up in training hours and in how many people you need on a Friday night, standing in the 15% of the floor the space rule-of-thumb gives to support. Budget the staff line against the machine you choose, not after it.
The money test has two halves: what the machine costs, and how long the floor takes to return it. According to JAMMA's comparison, multi-sport gear runs $10,000-70,000 against $15,000-150,000-plus for single-sport, with return on investment at 6-24 months against 9-36 months - the multi-sport band is cheaper to enter and faster to return, and both bands are vendor-reported rather than guaranteed. Our own published anchor sits inside that single-sport band and shows what the purchase looks like quoted turnkey: the all-in installed archery station is priced at $25,000-60,000.
JAMMA also publishes an illustrative single-bay case: $30,000 up front, an $8 fifteen-minute session, 24 sessions a day over 30 days (720 sessions a month), $5,760 of monthly gross, $4,032 of monthly net and payback at about 7.4 months. Its three-bay model runs CapEx of $75,000, $120,000 and $195,000 into annual gross of $158,000, $257,000 and $540,000, with payback at 1.4, 1.0 and 0.7 years and operating expense at 35-55% of gross. Those are the vendor's own illustrations - useful as arithmetic, not as a forecast - and the line below replays the single-bay version so the 7.4-month figure can be seen rather than quoted.
Build-side references from platform data point the same way for the deep format: an operator survey puts golf-bay construction at about $45,000 a bay, an FDD reconstruction puts it at about $62,000-68,000 a bay across a six-to-eight-bay build, and general buildouts run $40,000-75,000 a bay - against the same platform's steady-state $95,000-115,000 a year per bay. The term that decides the payback is utilization: below about 25% annual utilization a staffed four-bay venue cannot cover its fixed costs, and the first-year average sits near 33%.
The third capex shape is the ecosystem: build the room and pay the network instead of the machine. According to the Zero Latency licensing terms published by the network, operators hand over 16% of revenue and pay roughly $50,000 of fit-out separately to the contractor - capital-light at entry, and a permanent share of the till afterwards. Choose the shape before you choose the machine: the band you pick here is the band your payback lives in, and a 16% share reads very differently against a 6-24 month multi-sport window than it does against a 9-36 month single-sport one.
| Test | Multi-sport simulator | Single-sport gear | What decides it |
|---|---|---|---|
| 1. Revenue per m2 | No line of its own; judged by its lead sport | Archery about $960/m2/mo, shooting about $460/m2/mo (Verified) | Dedicated wins the meter, multi wins the mix |
| 2. Dwell and throughput | 30-60 min dwell, 20-40 guests/hour (JAMMA) | 60-120 min dwell, 10-20 guests/hour (JAMMA) | Multi turns faster, single holds longer |
| 3. Audience vs depth | Breadth: families, corporate groups, walk-ins | Depth: leagues, coaching, repeat training | Follow the calendar you can name |
| 4. Content and staff | Software updates add sports; one operator | Depth arrives as hardware; specialist staff | Update cost against training cost |
| 5. Capex and payback | $10,000-70,000, return in 6-24 months (JAMMA) | $15,000-150,000-plus, return in 9-36 months (JAMMA) | Multi is the cheaper first step |
| 6. When the trend moves | A new sport arrives as a software update | A better measurement arrives as hardware | Multi spreads the change across sports |
| Venue profile | Buy | The test that decides it |
|---|---|---|
| Small floor, mixed walk-in traffic, buying a first machine | One multi-sport bay | Tests 1-5: breadth plus a $10,000-70,000 first step (JAMMA) instead of a deep machine nobody has tried yet |
| Sport-led demand: leagues, coaching, repeat training | One single-sport machine | Tests 1 and 3: the measured $/m2 anchors and the depth the rate card already prices |
| Full-floor FEC with an existing entertainment calendar | Run both | Test 1 with Test 5: the published eight-zone center averages about $143/m2/mo because the mix is the model |
The defended answer, in buying order. Buy one multi-sport bay when the floor is small, the traffic is mixed and no single sport has proven demand in the catchment: it is the cheaper first step and it earns by turning the meter. Buy single-sport gear when the calendar already asks for the sport - the published archery corner books $2,800-6,100 a month across the 30-70% utilization band, and the measured scale puts that lane at about $960 per square meter per month - with the baseball simulator vs batting cage showing the depth-versus-throughput trade format by format. Run both when the room is a full floor: the published eight-zone center averages about $143 per square meter per month precisely because it mixes anchors with breadth. The revenue test ends where it started - the meter, the calendar, and the honesty to buy for the day you have rather than for the day you hope for. Whatever the tree returns, draw it on the actual plate first: the free 3D layout design places the bays, the per-square-meter comparison and the queue on your floor before any order is cut.
Per square meter the published scale favors dedicated gear: an archery lane books about $960 per square meter per month at 68% utilization against about $160 for a baseball bay including nets. On the entry test the multi-sport box wins - $10,000-70,000 and 6-24 months against $15,000-150,000-plus and 9-36 months (according to JAMMA, vendor-reported). On a full floor the answer is the mix: the published 1,000 square meter eight-zone center averages about $143 per square meter per month.
Every measured row in our published scale is a dedicated format - archery about $960/m2/month at 68% utilization, shooting about $460 at 62%, a VR arena $320, a baseball bay about $160 including nets. A multi-sport bay has no separate measured line: it is judged as the sport it leads with plus the 12-25 square meters the box occupies, so its revenue per square meter is a mix question rather than a machine question.
When you can name the weekday demand: a league, a coaching roster or a corporate training account. Depth carries the longer band - 9-36 months of return against 6-24 for multi-sport (according to JAMMA) - and it pays through the rate card: the published golf-bay reference is $95,000-115,000 a year at 36% utilization and $55 an hour. Buy the depth when the calendar is signed, not when the hardware is discounted.
On variety, yes: a multi-sport machine turns 20-40 guests an hour across a library of games (according to JAMMA), and add-on packs are cheap - a 14-game pack listed at $4,500-5,000 and a multisport sensor from $3,500. On measured density, no: the per-square-meter leaders in the published scale are dedicated lanes, and a box that can display archery does not book the archery lane figure of about $960 per square meter per month.
The vendor bands are 6-24 months for multi-sport against 9-36 months for single-sport (according to JAMMA). Worked from that same illustrative single-bay case - $30,000 up front and $4,032 net a month - payback lands at about 7.4 months. The term that moves both is utilization: below about 25% annual utilization a staffed four-bay venue cannot cover its fixed costs, and first-year utilization averages about 33%.
Send your floor area, catchment and calendar: we will return the multi-sport versus single-sport frame, the per-square-meter projection and the payback band, anchored with the Indoor AR Golf Simulator, the Immersive Indoor Baseball Batting Simulator and the Digital Archery Simulator A4.