The demand-side daily model behind the published $130-320 per chair per day: 12-30 paid rides at a $6-10 price, hour-by-hour footfall tiers, the scenario P&L with revenue and cost lines stated, and the payback frame checked against the published 4.5-month anchor.
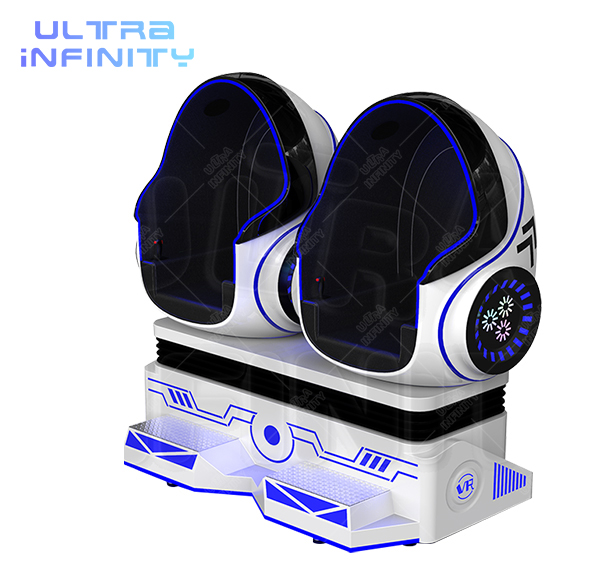
A VR egg chair is a one-seat motion capsule running 5-8 minute rides, priced per session, fed by footfall - and its published earnings band is $130-320 per chair per day with a roughly 4.5-month payback. The band is honest precisely because it is wide: the spread is not machine quality, it is demand - footfall, position and price, the three dials this guide runs. Where the published arcade guide asks whether the chair is profitable and the published 50-square-meter chair count asks how many fit, this guide opens the day itself: rides, revenue lines and the scenario P&L.
The planning anchors first, so every number below has a home: the published $6-12K unit and $130-320 per chair per day band; the $6-9 per six-minute heat the karting row charges; the 25-65 rides a day the published motorcycle impulse model scenarios; the row format's 60-90 rides per hour and 4-6 square meters per seat; and the $88-135 per-square-meter monthly ceiling that judges any footprint. The ride itself - yaw, pitch, the closed-capsule feel - is the published closed-capsule ride feel guide's subject; this guide prices it.
The demand model starts from the cycle: a 5-8 minute ride plus two to three minutes of turnaround means a continuously fed chair peaks at 6-9 rides an hour - the machine is never the bottleneck. The bottleneck is arrival: footfall feeds a lobby seat in waves, so the realistic day books 12-30 paid rides across an eight-to-ten-hour window. Weekend days compress those rides into queues; the published playbook on reducing queues turns the wait into counter time instead of lost riders.
| Footfall tier (EXAMPLE frame) | Rides/day | Price point | Daily gross (EXAMPLE) |
|---|---|---|---|
| Lobby corner, light traffic | 12-15 | $6-7 | $72-105 |
| Concourse line, mid traffic | 18-24 | $7-9 | $126-216 |
| Anchor-adjacent, strong weekend pull | 25-30 | $8-10 | $200-300 |
| Event or holiday spike day | 35-45 | $8-10 | $280-450 |
The table is a worked demand frame (EXAMPLE), interpolated across the published $130-320 band - the spike row shows why the band's ceiling exists without promising it: event days exist, they are just not the base rate. The gross line is daily revenue; what the operator keeps is the margin window the next section splits into cost lines.
Revenue lines, stated: per-ride fares are the engine (the published 60-70% rematch pattern in bigger formats hints what a second-ride prompt does here too); the siblings-and-parents spillover rides while the main party is elsewhere; and the between-ride minutes sell F&B at the counter - the same spectator-and-wait geometry the published studies measure. Cost lines, stated: power draw of a single motion seat is modest; staff is a share of one attendant who also runs the counter; maintenance is a consumables-and-checks cadence; and the footprint rent is the seat's 4-6 square meters judged against the $88-135 per-square-meter ceiling.
The published comparator set brackets the margin: karting rows run 49-55% with a 6-9 month payback, and the chair's lighter cost lines push its published payback to roughly 4.5 months. Planning assumptions, stated in one place: the scenario P&L below assumes a mid-band day (20 rides at $8), a $300 monthly share of rent-power-staff per chair, and a $150 monthly maintenance-and-content line - all EXAMPLE frames anchored to the published bands, not quotes.
The audit habit the model implies: the daily number decays through leaks - an unmanned seat, a dead content loop, a queue that gives up - and the published revenue-leak audit is the checklist that finds them before the monthly number does.
Who it is for: the buyer testing a first VR line item without anchor-format capital - one chair is the cheapest motion-format entry in the published comparators ($6-12K against karting's $18-28K open), and the daily model above is exactly how to test it against your own footfall before committing to a fleet. The fleet question - one chair, five chairs, the uptime math - is the published arcade chair profitability guide and the fleet-scaling guide's subject.
Where it fits: the payback frame, checked against your numbers. Basis: published payback runs around 4.5 months at the published band; the scenario here runs $160 average daily gross x 30 days = $4,800 monthly against a $9,000 installed cost - a first-order payback near two months on the strong-frame assumptions, which is why the honest answer is a range and why the 4.5-month published figure is the conservative read. The ride ladder, price tests and fleet steps are the next guides' subjects; the position test is today's - run the free 3D layout design on the lobby line before the lease decides it.
The published band runs $130-320 per chair per day. The demand math behind it: a footfall-fed seat running a 5-8 minute ride books roughly 12-30 paid rides a day across an eight-to-ten-hour day, and at a $6-10 per-ride price the gross lands inside the published band - the worked scenarios in this guide show which end of the band each footfall tier earns.
Footfall and position. A concourse-facing lobby seat with self-service flow rides the upper band; a back-corner seat depends on staff suggestion and lands at the bottom. The published motorcycle impulse model shows the same gradient at 25-65 rides a day - position is the demand dial.
Revenue. The margin window arrives from the published comparators: seat formats run light cost lines - power, a share of staff, maintenance, content - which is why the published chair payback lands around 4.5 months while bigger boxes run 6-9. The scenario P&L below splits the lines.
The seat cycle is 5-8 minutes plus turnaround, so a continuously fed chair peaks near 6-9 rides an hour - but demand, not the machine, is the limiter: the scenarios here run 12-30 rides a day because footfall arrives in waves, not on schedule. Compare the row format's published 60-90 rides per hour across five to ten seats.
The weekend uplift is real but shaped: traffic concentrates into queues, and the queue becomes the conversion problem - the published queue playbook routes the wait past the counter so the wait itself earns. The scenario table runs weekday and weekend days separately for that reason.
Placement within arm's reach of the waiting line. The spectator and queue positions convert captive minutes into rides - the published spectator-screen study prices the same geometry at +30% on the arena side - and the free 3D layout design tests the position before the lease does.
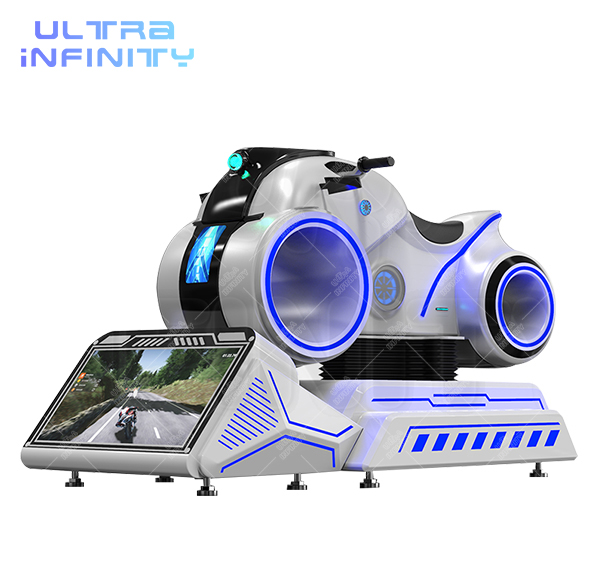
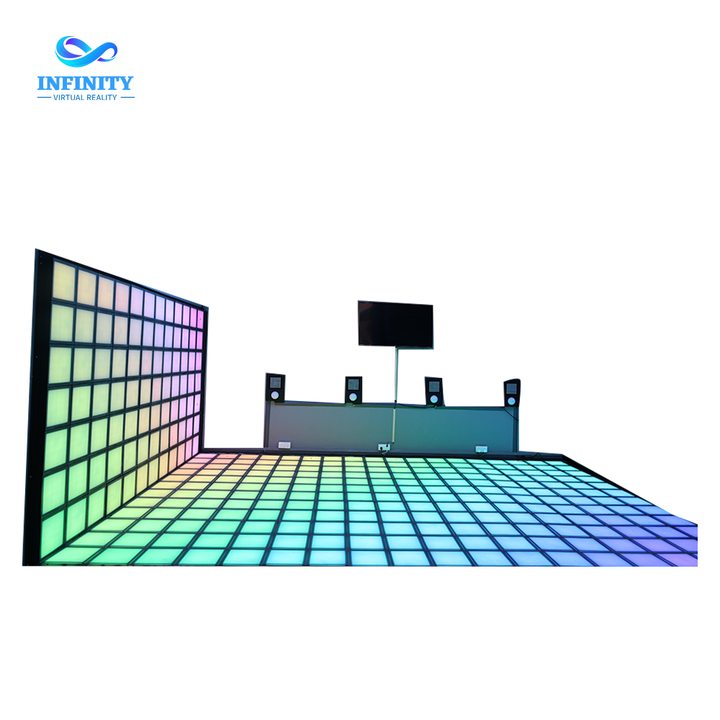
Send us your lobby line and traffic pattern: we will return the rides scenario, price ladder and payback frame through the free 3D layout design - anchored with the VR Egg Chair, the VR Motorcycle Simulator and the Infinity Grid LED Game.