Every multi-attraction venue runs two floors: the floor the guests see, and the arrival curve the operators live with. The curve is brutal in a specific way - attractions with similar session lengths and similar start times synchronize their queues. A racing row that clears a heat every 10 minutes and a chair bank that clears a session every 10 minutes will pile their walk-ins into the same 10-minute waves; by 3pm on a Saturday the lobby holds three separate queues and zero patience. The queue is not bad luck. It is a design object, and it can be designed down.
The published evidence sets the stakes. The published queue-management model for a 9D ride row shows pre-booking plus staggered starts doubling ride throughput - the same hardware, twice the sessions, purely by reshaping arrivals. The published survey of 600 players found 57% prefer multi-activity venues: guests come for the variety, which means they come to move between attractions - and the venue that cannot move them efficiently converts its own best feature into its worst bottleneck.
This playbook assembles the full lever set the published models point to: staggered session design, a visible session grid, pre-booking that converts the queue into a schedule, virtual queues that hold walk-ins profitably, and the staffing and floor-routing rules that make it work with three people per shift. Every number carries its basis; the worked Saturday scenario is labeled as a scenario.
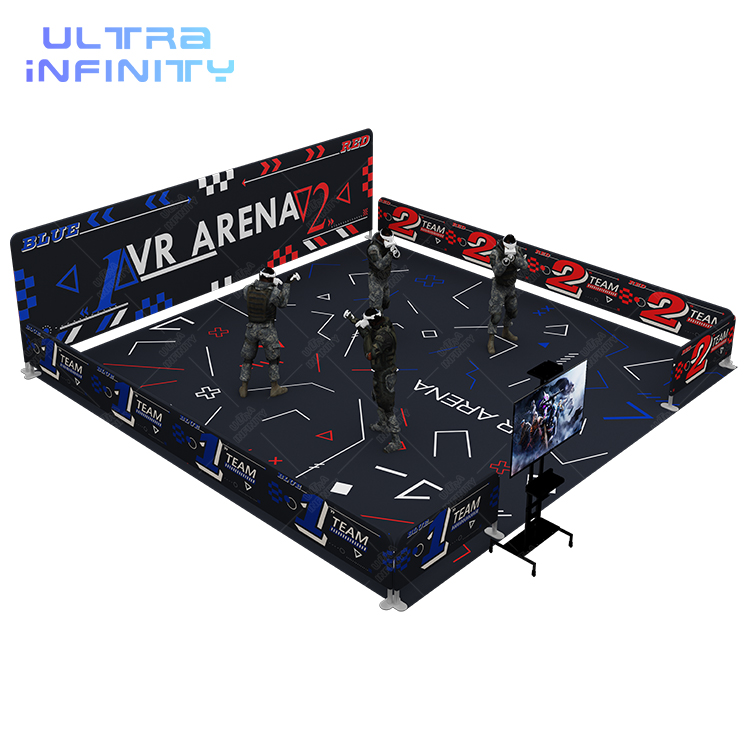
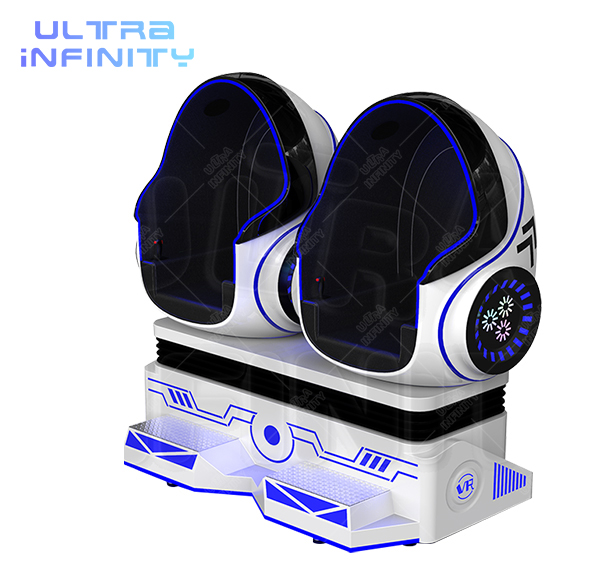
The first lever costs nothing and changes everything: design session lengths so no two attractions clear their queues at the same moment. The published dwell figures hand you the spread: a racing heat runs 8-12 minutes, a chair session 10-15, a grid-room block 15, a laser round about 15-20, and a free-roam arena session 35-50 minutes on the published figures. That is four to five distinct rhythms on one floor - the arrival waves spread themselves, and the queue marshal inherits a solvable problem instead of a synchronized pile-up.
The scenario floor runs it concretely: the racing row starts heats on the :00/:10/:20/:30/:40/:50 grid, the chairs accept walk-ins continuously on their own clock, the grid room opens blocks on the :05/:20/:35/:50 marks, and the arena books its 50-minute sessions on the hour. Changeover discipline is part of the lever: the published pattern treats changeover as the hidden capacity killer, so the scenario trains arena changeovers to 3 minutes instead of 8 - worth about 7% hourly capacity on a scenario basis, or one extra session per four booked.
The published session-stages guide for free-roam arenas shows the arena side of the lever: a session with defined stages - briefing, calibration, rounds, scoreboard - runs its full dwell on schedule, which is what makes the stagger reliable. An attraction whose sessions drift 10 minutes long silently destroys the whole floor's rhythm.
The second lever is visibility: publish the live session grid. Guests do not hate waiting - they hate not knowing. A screen at the entrance and a page on the venue site showing the next open slots per attraction lets guests self-schedule: race now, arena at 4pm, grid room at 4:20. The published queue model books this as the single cheapest throughput lever on the row; the scenario extends it floor-wide because the grid also spreads F&B orders - a guest holding a 4pm arena slot buys a coffee now, not a refund.
The third lever converts the queue into a schedule: pre-booking. Every ticket sold before arrival is a guest the lobby never queues. The scenario books the arena - the anchor attraction with the longest session and the largest groups - in two-session advance blocks, per the published group-size economics where the 6-8 player transactions carry the best per-guest revenue; parties and corporate groups pre-book, and the walk-in pool thins before it forms. The published party playbook adds the weekend dimension: birthday traffic pushed to off-peak slots with package pricing is pre-booking that also flattens the Saturday curve.
The fourth lever holds the walk-ins that pre-booking did not absorb: a virtual queue. Buzzer or app, a visible wait estimate, and a holding environment that earns while it waits. The scenario thresholds: up to 20-25 minutes the virtual queue holds - past that, the published abandonment pattern takes over and the guest leaves, costing the session and the F&B ticket behind it. At 40 minutes the counter stops selling walk-in slots and starts selling the next open grid slot; scarcity is the honest product at that point.
The holding environment is where the published numbers turn the wait into revenue. The published spectator-screen model found 72% of non-playing guests watch the action and venues that seat them with a screen lift drink sales about 30%; the published floor-balance design guide routes the queue past the F&B counter so the wait is a selling surface. The virtual queue is not a apology - it is the second-best seat in the house, priced at a beverage.
The fifth lever is the human one: a queue marshal on peak hours. One staff member with the live board re-routes short-queue guests, calls buzzers, and keeps the 3-minute changeover honest inside the arena. The scenario staffing plan runs three per shift - marshal, F&B host, float - and the marshal is the one the levers depend on: the grid and the buzzers do the herding, the marshal does the exceptions.
Planning assumptions, stated in one place. The worked scenario rests on: (1) a four-attraction floor - racing row (60-90 rides/hr published), chair bank (per the published chair model), grid room (up to $80/15min published), arena (24-40 players/hr published, 100-200m2); (2) a Saturday 11:00-18:00 peak window with walk-in-heavy arrivals; (3) queue-depth baselines and lever effects as scenario magnitudes calibrated to the published queue-management and dwell figures; (4) staffing at three per shift; (5) changeover trained from 8 to 3 minutes (scenario, on the published changeover pattern). Replace any assumption with your floor's telemetry and the model reruns.
| Lever | Cost to implement | Scenario effect | Basis |
|---|---|---|---|
| Staggered session design | None (schedule change) | Peak queue 38 to 27 guests | Published dwell spread 8-50 min across formats |
| Live session grid | One screen + page | 27 to 21 | Published queue-model self-scheduling pattern |
| Pre-booking + party off-peak | Booking flow | 21 to 14 | Published group-size and party-package models |
| Virtual queue + holding | Buzzers, seating | 14 to 9, holds 20-25 min | 72% watch, ~30% drink lift (published spectator model) |
| Queue marshal (peak) | One shift headcount | Holds the 3-min changeover | Scenario; published changeover pattern |
The cost of doing nothing is the mirror image. The synchronized-queue floor abandons guests at the 40-minute line, starves its shortest-queue attractions while the anchor pile-up grows, and pays the season's worst reviews for it. The published year-one mistakes list books queue chaos among the recurring year-one failures; the published laser-tag capacity and off-peak pricing guides show the same levers from inside a single attraction. The published queue-management throughput study remains the proof of scale - double the sessions, same machines - and the published floor-balance design guide is the architectural version of the same argument.
Run the five levers in order: stagger session lengths across attractions so queues never peak together; publish a live session grid so guests self-schedule; convert the queue into pre-booked slots; hold walk-ins with a virtual queue on the scoreboard; and staff a queue marshal on peak hours. The published queue-management model shows the ceiling: pre-booking plus staggered starts can double ride throughput on a 9D row without adding a single machine.
Stagger them deliberately: an 8-12 minute racing heat, a 35-50 minute arena session, a 15-minute grid-room block and 10-15 minute chair sessions never fill the queue at the same moment. The published dwell figures book exactly that spread - the mixed rhythms are what keep the arrival curve flat. Two attractions with identical session lengths and identical start times behave like one attraction with twice the queue.
Yes, when the wait is visible and wired to the floor. The published spectator-screen model found 72% of non-playing guests watch the action, and a guest who can see the live board, get a buzzer and buy a drink converts the wait into revenue instead of abandonment. The scenario in this guide holds walk-ins 20-25 minutes in a virtual queue - past that, the published abandonment pattern takes over and the guest leaves.
On the scenario thresholds in this guide: 20-25 minutes is the action line where the queue marshal re-routes guests to shorter attractions, and 40 minutes is the booking line where the counter stops selling walk-ins and starts selling the next open slot. The published 9D model treats every seat-minute of idle time as lost throughput - the same math says a guest who abandons a 40-minute queue costs the venue the session and the F&B ticket behind it.
Compress the session loop before you buy hardware: pre-book the arena in two-session blocks so changeover drops from 8 to 3 minutes (a scenario save worth about 7% hourly capacity, on the published changeover pattern), run the racing row in continuous heat cycles, and push birthday and party traffic to off-peak slots with the published party-package playbook. The published laser-tag off-peak guide shows the same lever from the pricing side.
Route them with the floor, not with staff voices: the published floor-balance design guide puts the queue path past the F&B counter and faces the attractions so waiting guests watch playing guests. The scoreboard, the buzzers and the sightlines do the herding - one queue marshal per peak shift manages what would otherwise take three staff shouting directions.
Send us your attraction list and peak pattern: we will return the session-stagger grid, the pre-booking structure and the floor routing through the free 3D layout design - anchored with the Free Roaming VR Arena 2.0, the Infinity CS Laser Tag System and the VR Egg Chair bank.