A VR flight simulator ROI is not a single number. It is three numbers, and which one you get depends entirely on which costs you agree to charge against the machine. Sitting underneath all three is a fourth number that nobody publishes: how many tickets you have to sell in an hour the doors are open before the machine stops losing money. This page gives you both, and it gives you them before any method discussion, because the answer you came for is short.
Here is that answer. One machine, a $12 mid-case ticket, 10 open hours a day, 26 operating days a month: 1,222 runs and $14,664 of gross revenue. Push the whole venue cost stack onto that gross at the 22 percent net margin reported in the Launch 2026 FDD and the machine carries $3,226 a month, which repays an installed CAPEX of $28,600 in about 8.9 months. Charge only the machine's own direct costs against it and payback stretches to 8.6 months in the low case. Charge labor at the reported 26 percent benchmark instead of one dedicated attendant and it compresses to 4.8 months. Across all three lenses the range is 1.9 to 13.7 months. The break-even line is 1.04 to 1.83 tickets per open hour, about 1 to 2 tickets, which is 12 to 22 percent of the 8.5 runs an hour a seven-minute cycle theoretically allows.
Assumption. A single-seat machine on a 7 minute cycle including clearing the cabin, 35 / 55 / 70 percent utilization against that cycle, 8 / 10 / 12 open hours a day, 26 operating days a month, and an $8 / $12 / $15 ticket band anchored on posted US prices rather than on any equipment maker assumption. Every input below is named with its source or labelled as our own planning model.
Formula. Monthly runs equal runs per hour times open hours per day times operating days per month. Monthly gross equals monthly runs times ticket. Payback months equal installed CAPEX divided by monthly net cash flow, never divided by gross revenue. Break-even runs per open hour equal monthly fixed cost divided by the net contribution of one run, then divided by operating days and open hours.
Result. The three lenses land where the table below puts them, and the break-even line lands at 1.04 / 1.46 / 1.83 tickets per open hour in the low, mid and high cases. The mid case - $12 ticket, 10 hours, 26 days, 55 percent utilization - is the case you should budget from, and the low case is the one you should be able to survive.
Limitation. This is a machine-level model, not a venue profit and loss statement. Ticket prices and utilization are third-party or our own planning model, not measured operator results. No US flight simulator operator publishes real revenue, so nothing on this page should be read as an industry benchmark or as a promise.
| Lens | What is charged against the machine | Payback, low to high | Mid case |
|---|---|---|---|
| Lens A - machine direct costs | Rent, one slice of an attendant, power, card fees and a maintenance reserve | 8.6 / 2.5 / 1.9 months | 2.5 months |
| Lens B - benchmarked labor | Same as lens A except labor is reset to the reported 26 percent of revenue instead of one dedicated head | 4.8 / 2.9 / 2.5 months | 2.9 months |
| Lens C - whole venue stack | Everything the venue spends, run at the reported 22 percent net margin (COGS, insurance, marketing, other) | 13.7 / 8.9 / 7.6 months | 8.9 months |
What this page delivers, and what it deliberately does not:
If you are still sizing the room rather than the return, start one level up: the VR flight and aerial combat zone guide for malls and family centers covers the whole zone layout and where a single machine sits inside it. The payback arithmetic for that machine is on this page.
Before any revenue model runs, it needs a ticket. Almost every published VR flying simulator ROI page on the first page of search results runs on a $5 to $7 assumption supplied by the equipment maker, and that assumption is the single largest unexamined input in their arithmetic. US venues post their prices publicly. We read them instead, and the gap is worth stating plainly: posted prices for comparable experiences sit between $8 and $15, not between $5 and $7.
Three anchors carry the argument. Birdly, a flight experience at Area15 in Las Vegas, charges $13.50 per adult for roughly three minutes of flying (thevirtualreviewer.com, accessed 2026-10-05). Hyper Zone VR at Fair Oaks Mall in Fairfax, Virginia posts $13.99 for a single ride on its published price sheet, with multi-ride bundles from $45 for four (hyperzonevr.com, accessed 2026-10-05). And a 2026 pricing study of 188 US VR venues, run across 42 metros between 2026-07-20 and 2026-07-25 and published 2026-08-03, found 72 venues with public prices: an overall median of $30 per person, and a median of $12 for the arcade-station category that a flight simulator belongs to, with that category running $5 to $45 (thevirtualreviewer.com, accessed 2026-10-05).
The floor of the range comes from a different direction. Dave and Buster's motion rides are observed at $5 to $6 per ride for about five minutes (thevirtualreviewer.com, accessed 2026-10-05), and a separate format study puts single booth and single-station sessions at $8 to $20 for 10 to 20 minutes (thevirtualreviewer.com, 2026-09-08, accessed 2026-10-05). Against that, one VR equipment maker describes its own flying simulator tickets as $5 to $15; that is a vendor-reported figure from a party with an interest in the answer, so it is quoted as reported and is not linked, and it never carries a conclusion on this page.
Assumption. Three posted US price points plus one published category study, all for VR or motion experiences rather than for this exact machine, all accessed 2026-10-05.
Formula. No calculation is needed here. The task is to replace a vendor assumption with an observed band and then choose three model points inside it.
Result. Model at $8 (low), $12 (mid) and $15 (high). $12 sits exactly on the published arcade-station median and $15 sits just under the two posted flight experiences at $13.50 and $13.99, so the high case is still inside what a US customer has already been shown on a price sheet.
Limitation. Every anchor above is a third-party posted price for a VR or motion experience, not a measured result for a flight simulator of this class. The United States has no published price sheet for flight simulator operators, which is why these are anchors and not facts about your venue. Treat the band as a starting position to test against your own local competition.
| Anchor | Observed price | Source and date | Confidence |
|---|---|---|---|
| Birdly flight experience, Area15 Las Vegas | $13.50 per adult, about 3 minutes | thevirtualreviewer.com, accessed 2026-10-05 | Supported - first-hand account |
| Hyper Zone VR, Fair Oaks Mall, Fairfax VA | $13.99 single ride; $45 / 4 rides | hyperzonevr.com published price sheet, accessed 2026-10-05 | Supported - official price sheet |
| Arcade-station category, 188 venue study | Median $12, band $5 to $45 | thevirtualreviewer.com pricing study, published 2026-08-03, accessed 2026-10-05 | Supported - sample stated |
| Dave and Buster's motion rides | $5 to $6 per ride, about 5 minutes | thevirtualreviewer.com, accessed 2026-10-05 | Supported - first-hand account |
| Single booth / single station sessions | $8 to $20, 10 to 20 minutes | thevirtualreviewer.com, 2026-09-08, accessed 2026-10-05 | Supported - published format study |
| Equipment maker ticket band | $5 to $15 | As reported by one VR equipment maker, 2026 | Vendor-reported - quoted, not linked, not used in conclusions |
Why this machine can hold the upper half of that band is a product question rather than a pricing question: the motion and takeoff cue is what the customer is paying for. The motion, takeoff and flying behaviour is set out on the page explaining how the motion simulates takeoff and flying, and it is the reason a session here is priced against a flight experience rather than against a stationary VR booth.
This is the section where vr flight simulator revenue stops being a claim and becomes arithmetic you can rerun on your own numbers. Two lines of formula carry the whole model, and every input into them is named below with a source or flagged as ours.
Formula. Monthly runs equal runs per hour multiplied by open hours per day multiplied by operating days per month. Monthly gross revenue equals monthly runs multiplied by the ticket price. Nothing else is in the model: no food, no membership, no upsell, no second machine.
Assumption. A 7 minute cycle including clearing the cabin, taken from a published throughput model that runs a 5 minute session plus 1.5 minutes of changeover and was reported by an equipment maker (accessed 2026-10-05); 60 divided by 7 gives 8.6, rounded down to 8.5 theoretical runs an hour as our arithmetic. Utilization is set at 35, 55 and 70 percent of that theoretical ceiling, where the 55 percent mid case comes from the same published blended utilization figure and the plus or minus 15 points are our sensitivity band. Open hours are 8, 10 and 12 a day against a vendor claim of 12 to 14 hours, deliberately taken at the conservative end. Operating days are 26 a month, our assumption for a venue open six or seven days a week.
| Input | Conservative | Mid | Aggressive | Source |
|---|---|---|---|---|
| Cycle time including changeover | 7 min | 7 min | 7 min | Published 5 min session + 1.5 min changeover, reported by an equipment maker, 2026-07-11 |
| Theoretical runs per hour | 8.5 | 8.5 | 8.5 | 60 / 7 rounded down (our arithmetic) |
| Utilization of the ceiling | 35% | 55% | 70% | Mid from published blended utilization; band is our sensitivity |
| Actual runs per hour | 3.0 | 4.7 | 6.0 | 8.5 multiplied by utilization (our arithmetic) |
| Open hours per day | 8 | 10 | 12 | Vendor claim of 12-14 h taken conservatively |
| Operating days per month | 26 | 26 | 26 | Our assumption |
| Ticket | $8 | $12 | $15 | US posted price band from the previous section |
Result. Monthly runs come out at 624, 1,222 and 1,872. Multiplied by the ticket band, monthly gross revenue is $4,992, $14,664 and $28,080. Expressed the way an operator actually experiences it, that is $24.00, $56.40 and $90.00 for every hour the doors are open, or $192, $564 and $1,080 a day.
| Monthly line | Conservative | Mid | Aggressive |
|---|---|---|---|
| Runs per hour x open hours x days | 3.0 x 8 x 26 | 4.7 x 10 x 26 | 6.0 x 12 x 26 |
| Monthly runs | 624 | 1,222 | 1,872 |
| Ticket applied | x $8 | x $12 | x $15 |
| Monthly gross revenue | $4,992 | $14,664 | $28,080 |
| Gross per open hour | $24.00 | $56.40 | $90.00 |
| Gross per operating day | $192 | $564 | $1,080 |
Consistency check, not validation. Three separate vendor-published models exist to compare against, and all three are interested parties. One equipment maker models a three-seat flying simulator at $8,760 to $12,264 a month on 3 runs an hour at $5 to $7 a seat. Another models a vertical wind tunnel at $512 to $1,440 a day at 8 to 12 riders an hour. A third reports a single machine at more than $2,100 a week. Our mid case of $14,664 falls inside the first band and our aggressive case reaches the top of it. That is a consistency check between models and nothing more: it is not evidence, and none of those figures is industry data.
Limitation. The catalog does not publish session length or throughput for this machine, so the 7 minute cycle and the 8.5 runs an hour are a planning reference built from a third-party throughput model, not a product specification. The 55 percent utilization anchor is also third-party and comes from a different machine type, so the same source problem sits under both numbers.
The yield question at zone scale, rather than machine scale, has its own answer: how much revenue a VR simulator zone can generate works the same inputs across a whole floor instead of a single seat. For the method behind reading a per-machine return at all, see how to calculate revenue per machine, which we treat as the prerequisite reading for the third lens in section five.
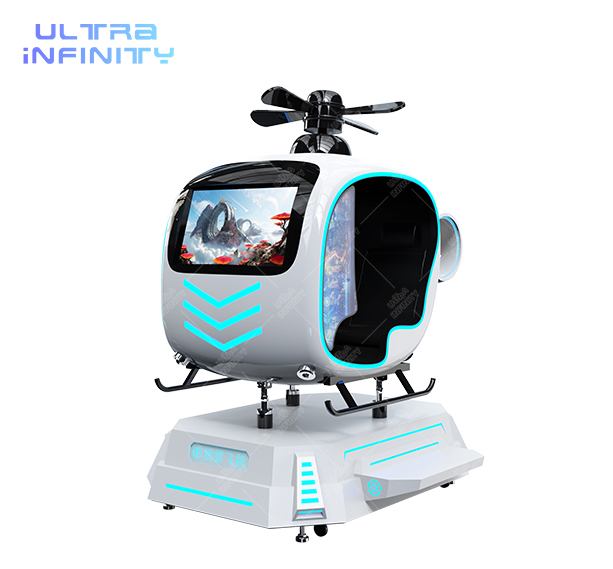
The machine this arithmetic runs on is the single-seat 9D build: the VR Flight Game Simulator - 9D VR Airplane Machine is rated at 1 kW and seats one rider, and our planning model puts a single seat at 12 to 16 riders an hour (registry last verified 2026-09-14), which brackets the 8.5 to 6.0 runs an hour used above rather than replacing them.
The revenue side of a VR flight simulator ROI can be argued with all day, because the inputs are somebody else's price sheet. The cost side does not have that problem. Three US official or published series cover almost the whole machine-level cost stack: commercial electricity from the Energy Information Administration, amusement attendant wages from the Bureau of Labor Statistics, and retail asking rent from Cushman and Wakefield. This section runs all three.
Power. The EIA commercial electricity rate for July 2026 is 14.53 cents a kilowatt-hour (Electric Power Monthly Table 5.6.A, data for July 2026, released 2026-09-24, accessed 2026-10-05). Rated draw for the two builds in this article is 1 kW for the single seat and 2.5 kW for the two-seat helicopter (first-party catalog specification). Running those draws against 8, 10 and 12 open hours a day for 26 days gives $30, $38 and $113 a month. The third figure is the aggressive case, where the larger cabinet runs the longest day.
Labor. The BLS Occupational Employment and Wage Statistics for 2025 puts amusement and recreation attendants at $13.00 an hour in Atlanta, $17.04 in Phoenix and $18.23 in New York (snapshot taken 2026-09-20, accessed 2026-10-05). Against three staffing patterns - one attendant for one machine on an 8 hour day, one attendant covering two machines on a 10 hour day, one attendant covering four machines on a 12 hour day - the monthly labor line is $2,704, $2,215 and $1,422. The coverage ratios are our configuration assumption; the half-self-service operating pattern they assume is reported by an equipment maker rather than measured.
Rent. Cushman and Wakefield put US retail asking rent at $25.65 per square foot per year for Q2 2026, up 2.2 percent year on year (US Retail MarketBeat Q2-2026, accessed 2026-10-05). One line of assumption carries the allocation: 100, 160 and 250 square feet including safety clearance and the queue. That single assumption produces $214, $342 and $534 a month. It is stated once, used once, and never turned into a capacity number - floor area math belongs to the space article in this batch. Read the figure as an inline retail asking basis; a kiosk in an atrium is quoted as a monthly total locally and would need its own number.
Two lines that are ours. Card processing at 3 percent of gross gives $150, $440 and $842 a month; we could not find a citable source for that rate, so it is labelled our assumption every time it appears. A maintenance, content and insurance reserve of $150, $250 and $400 a month is a directional analogy to a published annual allowance for a different attraction class, and it is used for range only, never inside a conclusion sentence.
Formula. Monthly power equals rated kW multiplied by open hours per day, operating days per month and the tariff. Monthly rent equals allocated square feet multiplied by annual asking rent and divided by twelve. Monthly labor equals hourly wage multiplied by open hours and operating days, then divided by the number of machines one person covers.
Result. Machine-direct cost totals $3,248, $3,285 and $3,311 a month. The total barely moves across the three cases - rent and card fees rise as revenue rises while labor falls - which is exactly why labor share of gross is the number worth reading. Attendant labor runs 54.2 percent of gross in the conservative case, 15.1 percent in the mid case and 5.1 percent in the aggressive case.
| Monthly cost line | Conservative | Mid | Aggressive | Source |
|---|---|---|---|---|
| Allocated rent | $214 | $342 | $534 | C&W US retail asking rent $25.65 / sq ft / yr, Q2 2026, accessed 2026-10-05 |
| Attendant labor | $2,704 | $2,215 | $1,422 | BLS OEWS 2025 amusement attendants $13.00 / $17.04 / $18.23, snapshot 2026-09-20 |
| Electricity | $30 | $38 | $113 | EIA commercial tariff 14.53 cents / kWh, July 2026 data, accessed 2026-10-05 |
| Card fees at 3 percent | $150 | $440 | $842 | Our assumption, no source found |
| Maintenance, content, insurance reserve | $150 | $250 | $400 | Directional analogy |
| Machine-direct total | $3,248 | $3,285 | $3,311 | Our arithmetic |
| Attendant labor as a share of gross | 54.2% | 15.1% | 5.1% | Our arithmetic |
The comparison that matters. Set 54.2 percent against the two published benchmarks. The Launch 2026 FDD reports labor at 26 percent of revenue with profit at 22 percent (accessed 2026-10-05), and the IAAPA 2025 Entertainment Center Benchmark Report puts labor at 29 percent, the largest single expense line in the format (quoted second-hand, the report itself sits behind a paywall, accessed 2026-10-05). A single machine staffed with one dedicated attendant at low traffic therefore spends more than twice the industry share on labor. That is not a modeling artifact; it is what happens when a fixed single-head role is charged against a machine that is only running a third of its capacity.
Limitation. Only the floor attendant line is included, and BLS publishes wages rather than fully loaded cost: the BLS Employer Costs for Employee Compensation series puts total private full-time compensation at 1.43 times wages (accessed 2026-09-20), so labor is understated by roughly that factor and the 54.2 percent figure is a floor rather than a ceiling. Building HVAC and lighting allocation is not included either; a published FEC cost guide puts utilities and maintenance at 3 to 6 percent of revenue and we have only charged the machine draw. Rent is an asking rate, not a signed lease.
Two readings sit either side of this section. How much room the allocation assumption is standing in for is the subject of how much space a VR flight simulator needs, and what else has to be purchased and installed beside the cabinet is on the complete setup and equipment list, which we deliberately do not price here.
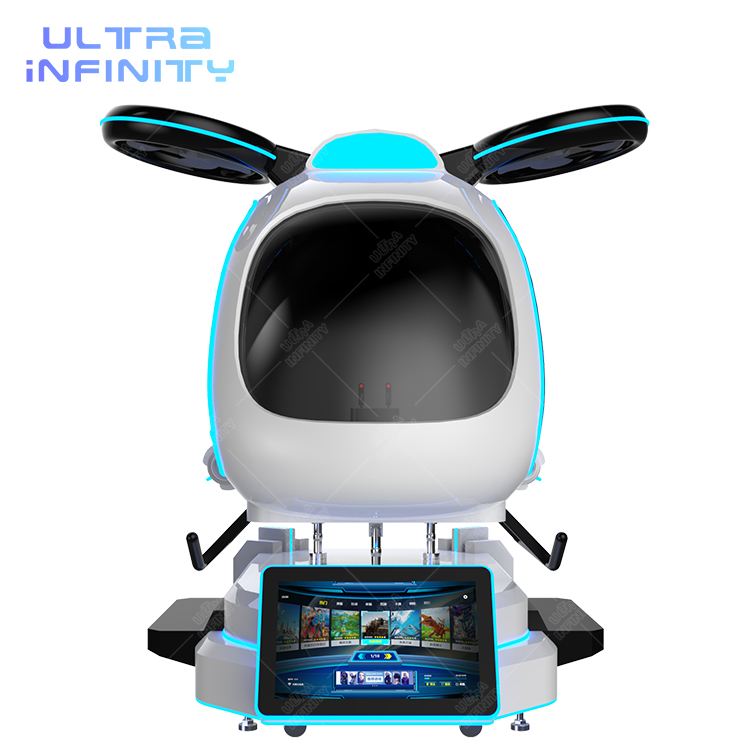
The cost arithmetic above changes with the cabinet you choose. The two-seat build, the VR Helicopter Game Simulator 2 Players, is rated at 2.5 kW rather than 1 kW, which is what pushes the electricity line from $38 to $113 in the long-day case while also doubling the theoretical revenue ceiling. Section six takes up the constraint that moves with it.
This is the section the rest of the page exists to deliver, and it is where vr flight simulator profitable gets an honest answer: profitable under which cost treatment? Published payback figures almost never state which costs are inside the division, which is why a single machine can plausibly be described as both a 2 month and a 14 month proposition by people who are not lying.
The divisor. Installed CAPEX for the payback division is $15,000 in the conservative case, $28,600 in the mid case and $47,250 in the aggressive case. These are installed figures: the machine plus freight, duty, destination handling and commissioning at 25, 30 and 35 percent landing uplift, using a published registry calculation for the uplift range (last verified 2026-09-19). That row exists in this table only as the input to the division below. Machine price bands and total cost of ownership are owned by the cost article in this batch, are not reproduced here, and are not combined with the percentage basis used for the uplift. Purchase price bands and total cost of ownership stay on that page.
Formula. Payback months equal installed CAPEX divided by monthly net cash flow. Gross revenue is never the denominator; every lens below divides by a net figure.
Result. The three lenses, each run at all three utilization cases:
| Line | Conservative | Mid | Aggressive |
|---|---|---|---|
| Installed CAPEX (payback divisor only) | $15,000 | $28,600 | $47,250 |
| Lens A - machine direct costs, monthly net | $1,744 | $11,379 | $24,769 |
| Lens A - payback | 8.6 months | 2.5 months | 1.9 months |
| Lens B - labor reset to 26 percent, monthly net | $3,150 | $9,781 | $18,890 |
| Lens B - payback | 4.8 months | 2.9 months | 2.5 months |
| Lens C - whole venue at 22 percent net margin, monthly net | $1,098 | $3,226 | $6,178 |
| Lens C - payback | 13.7 months | 8.9 months | 7.6 months |
How to read the three.
Limitation. Lens C applies somebody else's franchise disclosure net margin to this machine; it is not this machine's measured result. Lenses A and B omit management time, taxes, debt service and pre-opening marketing. None of the three counts residual value or a content refresh cycle, so this is a twelve month payback view and not a three year return.
Three companion reads sit around this table. The method behind dividing CAPEX by net cash flow is set out in how to calculate revenue per machine. The same-type revenue-per-hour cross-check is VR racing simulator revenue per hour, which we read as a comparison and do not import numbers from. And the installed figure in the first row is broken down on how much a commercial VR flight simulator costs.
Every published ROI page in this category gives a payback month count. None of them answers the question an operator actually asks in week four, which is how many people have to walk up to the cabinet before it stops costing me money. This is the one number on this page that we have not found anywhere else.
Formula. Break-even runs per open hour equals monthly fixed cost divided by the net contribution of one run, then divided by operating days and then by open hours. Fixed cost here is rent plus labor at the reported 26 percent benchmark plus the reserve. The net contribution of one run is the ticket multiplied by 97 percent, after the card fee, less the electricity attributable to that run.
Assumption. Fixed monthly cost of $1,662, $4,405 and $8,235 across the three cases. Contribution per run of $7.71, $11.61 and $14.49. The 3 percent card fee remains our own assumption with no source.
| Break-even line | Conservative | Mid | Aggressive |
|---|---|---|---|
| Monthly fixed cost (rent + 26 percent labor + reserve) | $1,662 | $4,405 | $8,235 |
| Net contribution per run | $7.71 | $11.61 | $14.49 |
| Runs required per month | 216 | 379 | 568 |
| Break-even runs per open hour | 1.04 | 1.46 | 1.83 |
| Share of the 8.5 theoretical runs an hour | 12% | 17% | 22% |
| Modeled runs per hour at that case | 3.0 | 4.7 | 6.0 |
| Safety margin above break-even | 2.9x | 3.2x | 3.3x |
Result. One to two tickets an hour. In the conservative case you need 1.04 runs per open hour, which is 12 percent of the theoretical ceiling. In the mid case 1.46 runs an hour, 17 percent. In the aggressive case 1.83 runs an hour, 22 percent. Against a modeled 3.0, 4.7 and 6.0 runs an hour the machine clears its own break-even roughly three times over at every utilization level we tested.
The sensitivity worth losing sleep over. The payback span from 13.7 months to 7.6 months in lens C is produced by one input moving from 35 percent to 70 percent. Not by cost, not by ticket, not by capital. No published source has ever measured real utilization for a flight simulator of this class, which means the entire risk of this investment sits on the traffic side of the model rather than on the cost side. Costs you can negotiate. Footfall you have to go and find.
Limitation. This break-even covers direct machine cost plus labor at the benchmarked rate only. It excludes management, taxes, debt and pre-opening marketing, so it is the machine ceiling rather than the business ceiling. Ticket anchors and the utilization anchor are third-party. Card fees are our assumption. Multi-seat fill is not modeled: a two seat machine doubles the theoretical ceiling, but the binding constraint becomes riders per run rather than runs per hour, and we do not have riders-per-run data, so every figure above is run on the single-seat assumption as the conservative case.
The consolidated caveat list for this whole page: third-party ticket and utilization data; venue dependence on local footfall, local rent and local wages; no US flight simulator operator publishes revenue of any kind, so no figure here is industry data; the 3 percent card fee is our assumption; multi-seat fill is unmodeled; and a machine-level model is not a venue profit and loss statement.
Two seats change the shape of the constraint rather than the arithmetic. The alternate two seat build, the Black VR Helicopter Game Simulator 2 Players, carries the same L2630 x W2420 x H1600 mm frame at 2.5 kW, so the same fixed cost lines apply and only the ceiling doubles - which is exactly why riders per run, not runs per hour, would become the number to measure first.
The arithmetic in the last six sections points at one operational decision that most venues get backwards. Staffing is usually set by the opening hours of the building. On a machine with this cost shape it should be set by the break-even line instead, and the two are not close to each other.
Numbers used above. Attendant labor at 54.2, 15.1 and 5.1 percent of gross; break-even at 1.04, 1.46 and 1.83 runs an open hour; the 26 percent labor benchmark reported in the Launch 2026 FDD (accessed 2026-10-05); the 29 percent figure quoted second-hand from the IAAPA 2025 benchmark report (accessed 2026-10-05); and the 55 percent utilization anchor reported by an equipment maker (accessed 2026-10-05).
Limitation. The coverage ratio is our configuration assumption, the three-to-four machine figure is reported by an interested party, and BLS wage data excludes benefits - the BLS compensation series puts fully loaded cost at 1.43 times wages, so a real attendant costs meaningfully more than the line above suggests.
When the staffing line is set, the remaining question is what else the budget has to cover besides the cabinet, and that is answered in the FAQ below before the models that match these three cost cases.
Between 1.9 and 13.7 months, depending on which costs you charge against the machine. Machine direct costs only: 1.9 to 8.6 months. Labor reset to the reported 26 percent benchmark: 2.5 to 4.8 months. The whole venue cost stack at the reported 22 percent net margin: 7.6 to 13.7 months, with 8.9 months in the mid case. Inputs are a $12 ticket, 10 open hours a day and 26 operating days a month (our planning model, 2026-10-05). Read it as a range that moves with utilization, not as a commitment.
Modeled gross revenue is $4,992, $14,664 and $28,080 a month for one machine, from 624, 1,222 and 1,872 runs at $8, $12 and $15. The formula is monthly runs equal runs per hour times open hours per day times operating days per month, and monthly gross equals monthly runs times ticket. This is our planning model; the ticket anchors are third-party posted US prices accessed 2026-10-05, and no US flight simulator operator publishes revenue.
At the whole venue lens it nets about $1,098, $3,226 and $6,178 a month, which is payback of 13.7, 8.9 and 7.6 months on the installed CAPEX divisor. Those nets use the 22 percent net margin reported in the Launch 2026 FDD (accessed 2026-10-05), so it is somebody else's franchise margin rather than this machine's measured result. The lens-C range also sits inside the 12 to 18 month arcade payback figure published in an IAAPA guide (snapshot 2026-09-21).
1.04, 1.46 and 1.83 tickets per open hour in the conservative, mid and aggressive cases, which is 12, 17 and 22 percent of the 8.5 runs an hour a seven minute cycle allows. The formula is monthly fixed cost divided by the net contribution of one run, then divided by operating days and open hours. That covers direct machine cost plus labor at the 26 percent benchmark only, not management, taxes or debt.
Model at $8, $12 and $15. The mid point sits on the published arcade-station median of $12 from a 2026 study of 188 US venues (published 2026-08-03), and nearby anchors are $13.50 for the Birdly flight experience at Area15 in Las Vegas and $13.99 for a single ride at Hyper Zone VR at Fair Oaks Mall, both accessed 2026-10-05. Motion rides at $5 to $6 set the floor. Every one of these is a third-party posted price for a VR or motion experience, not a measured result for this machine.
Power of $30 to $113 a month at the EIA commercial tariff of 14.53 cents a kilowatt-hour (July 2026 data, accessed 2026-10-05); attendant labor of $1,422 to $2,704 at BLS OEWS 2025 wages of $13.00 to $18.23 an hour depending on coverage (snapshot 2026-09-20); rent of $214 to $534 at the C&W US retail asking rate of $25.65 per square foot per year for Q2 2026 (accessed 2026-10-05); card fees at 3 percent, which is our own assumption; and a $150 to $400 reserve. Machine purchase price and total cost of ownership are covered by the sister cost article in this batch. Benefits at 1.43 times wages, management time and taxes are not included.
Want to estimate the right attraction mix for your investment? Request a customized venue plan and free 3D layout. Send the utilization you can actually defend and we will run the three lenses above on your own wage band and rent.