Ask ten people in this industry for a venue's break-even point and you will get ten hand-waves. This guide does the opposite: it assembles the published cost and margin figures from working zone models on this site, builds one clearly-labeled worked scenario on top of them, and shows the full arithmetic - fixed costs, contribution margin, the break-even revenue line, and what that line demands in daily visits. Every zone number is a published figure with a link; every scenario number is labeled as an example, so the calculation can be rerun with your own rent and staffing in ten minutes.
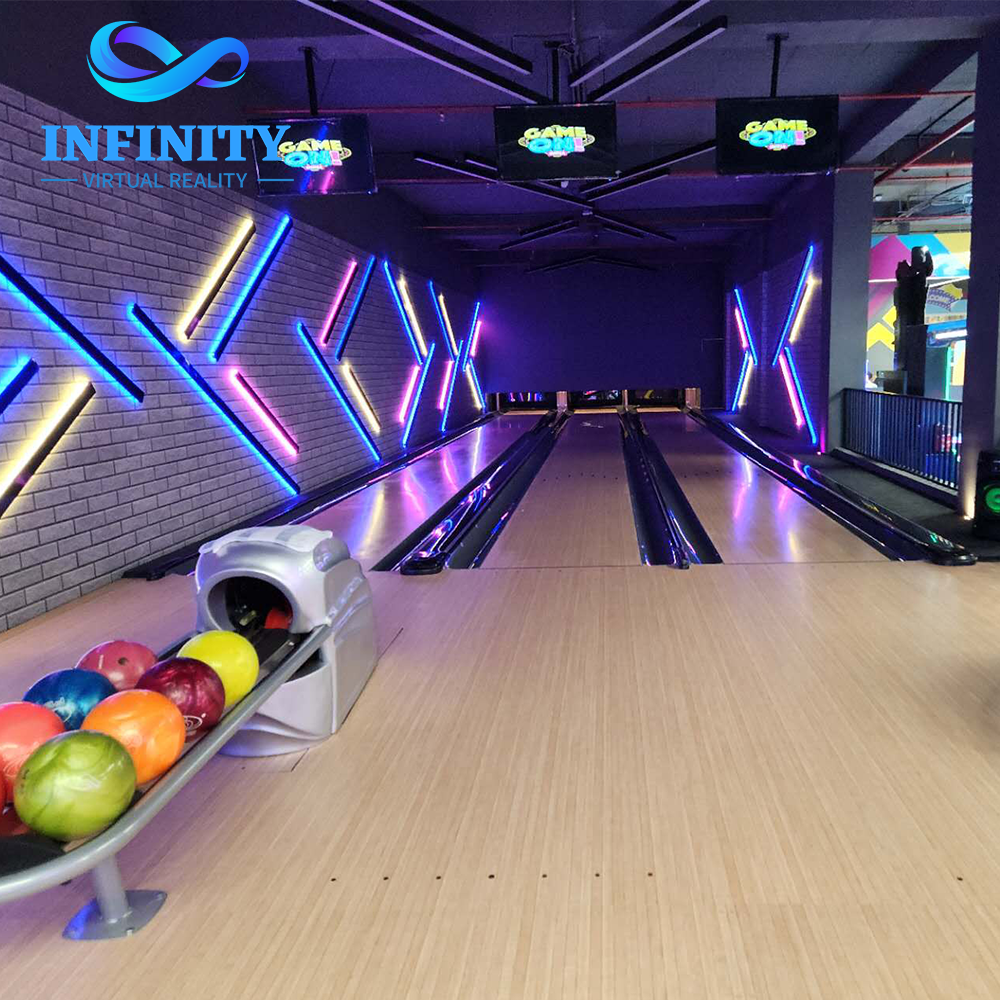
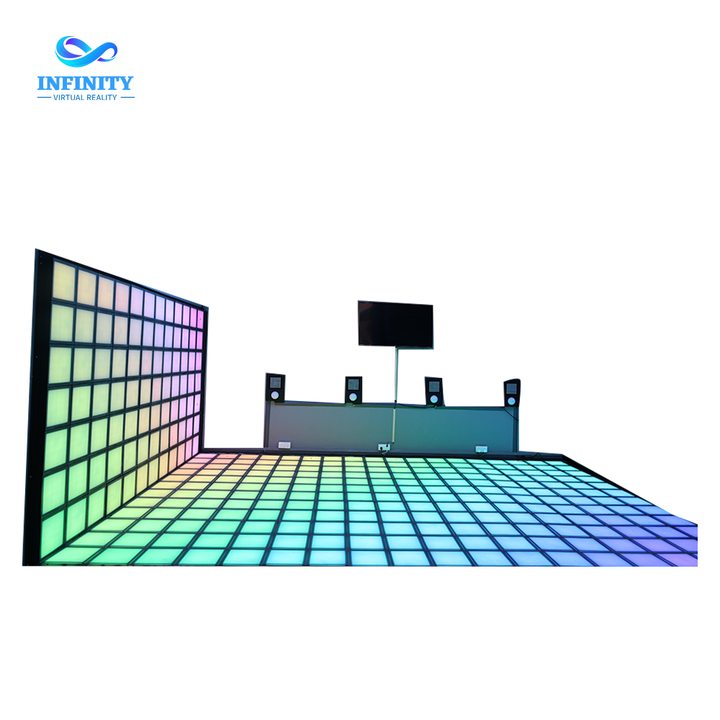
The scenario: a 500m2 indoor entertainment venue running a duckpin pair, an LED grid room, a four-kart simulator row and a small events calendar - the compact stack the published equipment ranking favors for first-time operators. The question the guide answers: what monthly revenue puts this venue exactly at zero, and how many visits does that take?
Break-even starts with the costs that do not care whether anyone shows up. The published models anchor the components: the kids karting zone carries $3,800-5,500 of monthly OPEX for a 45m2 zone (blog 795), the duckpin package lands at $30,000 of equipment inside a $40,000-48,000 opening (blog 2655), and the published cost analysis walks the full opening budget category by category. Scaling those anchors to a 500m2 floor produces the scenario's fixed-cost stack - a labeled example, not a quote: rent $9,000 (500m2 at an $18/m2 scenario rate), staffing $10,400 (four FTE at a $2,600 scenario cost), utilities $2,500, base marketing $2,000, insurance and other $1,500. Total: $25,400 a month that the venue owes before the first coin drops.
Two habits from the published models keep this stack honest. First, the published year-one mistakes list flags under-budgeted staffing as the classic error - the attendant who runs the party room is not optional on a Saturday, so the stack must price the busy Saturday, not the quiet Tuesday. Second, the published cost analysis separates fixed from variable deliberately: consumables, payment fees and per-session power belong to the variable side and show up next, inside the contribution margin - mixing the two is what makes most back-of-napkin break-evens wrong.
The contribution margin is the share of each revenue dollar left after variable delivery costs, and the published models give it a real range: the kids karting zone runs a 49-55% direct operating margin (blog 795), and the published laser analysis attributes a 66% margin to F&B contribution - the add-on that rides along with every party. A venue whose revenue is dominated by attraction tickets therefore plans on a blended 50-55% scenario margin; the worked model uses 55% and the sensitivity section shows what 50% does to the line. The revenue lines themselves are published too: $6-9 per kart heat, $11 per laser round, $80 per 15-minute grid-room session for 4-8 players, $130-320 per chair per day on the chair fleet.
This is the step where the published earnings guide earns its keep: the $88-135 per square meter monthly revenue ceiling is the realistic top of the revenue stack, and it caps what any mix can bill per month. The break-even calculation has to clear costs below that ceiling - which is precisely the check section four runs.
The arithmetic takes three lines. Fixed costs: $25,400 (the scenario stack above). Contribution margin ratio: 55% (based on the published 49-55% karting zone margin). Break-even revenue: $25,400 divided by 0.55 = $46,182 a month. Translated into traffic at published price points: 5,131 visits at a $9 average spend (the kart-heat band midpoint), or 4,199 at the published $11 laser round, or about 171 visits a day on a 30-day month at $9. Each step carries its basis: the costs are a scenario, the margin is based on a published zone model, and the price points are published figures.
Planning assumptions, stated in one place. Every number in the table below rests on these assumptions: (1) rent at an $18/m2 scenario rate on 500m2 - a scenario line on the published cost-analysis categories; (2) four FTE at a $2,600 scenario monthly cost each; (3) utilities $2,500, base marketing $2,000, insurance and other $1,500 - scenario lines; (4) a 55% blended contribution margin based on the published 49-55% karting zone margin; (5) a $9 scenario average spend on the published $6-9 heat band, cross-checked against the published $11 laser round; (6) the published 30-70% utilization band as the sensitivity frame. Replace any assumption with your own quote and the same three-line arithmetic reruns unchanged.
| Step | Input | Value | Basis |
|---|---|---|---|
| 1 | Monthly fixed costs (scenario) | $25,400 | EXAMPLE stack on published OPEX anchors (blog 795) |
| 2 | Contribution margin ratio | 55% | Based on published 49-55% karting margin (blog 795) |
| 3 | Break-even revenue | $46,182 / month | $25,400 / 0.55 (scenario math) |
| 4 | Visits at $9 average spend | 5,131 / month (about 171/day) | Scenario average on published $6-9 heat band |
| 5 | Visits at $11 average spend | 4,199 / month (about 140/day) | Published laser round price (blog 2682) |
| 6 | Ceiling check (500m2) | $44,000-67,500 | Published $88-135/m2 ceiling (blog 828) |
The chart's shape is the lesson. The laser arena at the floor of the published utilization band ($22,464) sits far below the scenario line; the same arena at the top of the band ($52,416) clears it by $6,234 a month - and the karting zone, the best per-square-meter earner in its published class, clears break-even only as part of a stack. A single zone rarely carries a venue past the line; the mix does.
Four published levers move the break-even line. Utilization: the published 30-70% band swings the laser arena 2.3x ($22,464-52,416), the single biggest variable a venue controls - and the published capacity model shows the levers inside it (session turnover, the 16-player session, weekday blocks). Contribution margin: at a 50% scenario margin the break-even revenue rises to $50,800 (example math on the same stack); every point of margin moves the line by roughly $920. Average spend: F&B and party add-ons ride the published 66% laser F&B margin, so the spend mix - not just the ticket count - decides the real line. Square meters: the published ceiling check above - if break-even revenue exceeds $88-135/m2 for your floor, the model fails on paper before it fails in person.
Payback is the line's clock, and the published windows are short where the stack starts small: about 4.5 months for the chair fleet on the published chair model, 6-9 months for the karting zone on the published kids-karting model, and 8 months for the battleship cinema on the published battleship model. The published laser capacity model puts the biggest single-format bet at breakeven-27%-occupancy, and the published earnings guide shows how the stack compounds past the line toward the published ceiling. The sequencing rule from the published equipment ranking closes the loop: buy the fast-payback zones first, let them fund the slow ones, and re-run this calculation every time rent or staffing changes - the break-even point is a living number, not a one-time certificate.
It depends on fixed costs and contribution margin, and both have published anchors. The worked scenario in this guide - a 500m2 venue with $25,400 of monthly fixed costs at a 55% contribution margin (based on the published 49-55% karting zone margin) - breaks even at $46,182 of monthly revenue, which is about 5,131 visits at a $9 average spend or roughly 171 visits a day. A venue with lower rent or a leaner staff moves the line down; the published laser model shows the same logic compressed into one number: breakeven at 27% occupancy.
The formula is fixed costs divided by contribution margin ratio. Step one: list every cost that does not move with ticket volume - rent, salaries, utilities, insurance, base marketing. Step two: compute the contribution margin, the share of each revenue dollar left after the variable costs of delivering the attraction (consumables, payment fees, per-session power). Step three: divide. The published models make step two concrete: the kids karting zone runs a 49-55% direct margin, so a blended 55% scenario margin for a venue dominated by attraction revenue is a defensible planning basis (per the published zone model).
On the scenario math: $46,182 of monthly revenue at a $9 average spend is 5,131 visits a month, or about 171 a day over a 30-day month. The published price points put that in context - the kart heat runs $6-9 and the published laser round averages $11 - so a venue averaging the laser price needs about 4,199 visits (140 a day). Group formats change the arithmetic fastest: a published 16-player laser session books $176 in one transaction, which is why the utilization lever in the next question matters more than walk-in counts.
The published utilization band is the single biggest swing. The 16-player laser arena grosses $22,464 a month at 30% utilization and $52,416 at 70% - the same equipment, a 2.3x spread (based on the published capacity model). Against the scenario break-even of $46,182, the floor of the band is underwater and the top of the bank clears it with room to spare. That is exactly why the published marketing playbook targets weekday school blocks, leagues and corporate buyouts: utilization, not ticket price, decides which side of the line a month lands on.
The published ceiling runs $88-135 of monthly revenue per square meter. A 500m2 venue maxes that band at $44,000-67,500 - which means the $46,182 scenario break-even sits just above the floor of the published band and comfortably inside it. The practical read: if your fixed-cost stack pushes your break-even revenue above the published ceiling for your square meters, no realistic utilization rescues the model - cut fixed costs or add bookable square meters before signing the lease.
The published payback windows give the ladder: a VR chair fleet lands at about 4.5 months, a kids karting zone at 6-9 months, and a battleship cinema at 8 months on the published models. Payback counts the opening investment, not just the monthly line - which is why the published equipment ranking advises sequencing buys by payback speed and letting the fast zones fund the slow ones (per the published investment model).
Send us your square meters, rent and staffing quotes: we will return the fixed-cost stack, the contribution-margin plan (based on the published zone models) and the payback projection through the free 3D layout design - anchored with the Duckpin Bowling System, the Infinity Grid LED Floor or the VR Racing Simulator row.