Sportainment stopped being a buzzword the moment the numbers arrived. The published definition work (what is sportainment) fixed the category, the published revenue model (the $88/m2 model) priced it, and the 2026 trend list is now measurable in percentages and dollars rather than conference talks. Every trend on this list carries a published reference - and the pattern across all ten is the same: the venues winning 2026 are the ones that convert a measured preference into a zone, a rate card or a calendar.
The ranking follows the evidence weight: the 57% multi-activity preference tops the list because it is the demand side every other trend serves. The phased-budget trend follows - the published ladder from a $30K duckpin entry to full zone stacks is how single-attraction arcades become sportainment without a second mortgage. The retention trend runs on measured hardware: the published leaderboard analysis at 60% higher repeat and the free-roam dwell study at 40 extra minutes per group.
| Rank | Trend | The Published Number Behind It |
|---|---|---|
| 1 | Multi-activity floors become the default | 57% prefer multi vs 17% single (n=600) |
| 2 | Phased entry budgets | $30K duckpin package; $40-48K total opening |
| 3 | Retention systems over novelty hardware | 60% higher repeat with leaderboards |
| 4 | Free-roam as the dwell anchor | +40 minutes per group |
| 5 | Revenue-per-hour as the buying test | The $320/hour attraction test |
| 6 | Spectator economics | 72% queue viewing; 25-35% beverage lift |
| 7 | Structured weekday demand | Schools $300-600; leagues $400-600/night |
| 8 | Revenue-density planning | $88-135/m2 monthly ceilings |
| 9 | Compact footprints with 14-18 month payback | Published compact build window |
| 10 | Zone-stack floor plans | Five-zone model, ~15% back of house |
The trends compound because each one feeds the next: the multi-activity preference justifies the zone stack, the zone stack creates the spectator positions, the spectator positions lift beverage revenue, and the retention systems turn the lifted traffic into returners. Modelled on the published anchors - a compact build opening at the published $40-48K, scaling toward the published $88-135 per square meter monthly ceiling as zones and systems come online - the revenue curve is the argument for adopting trends in order rather than all at once.
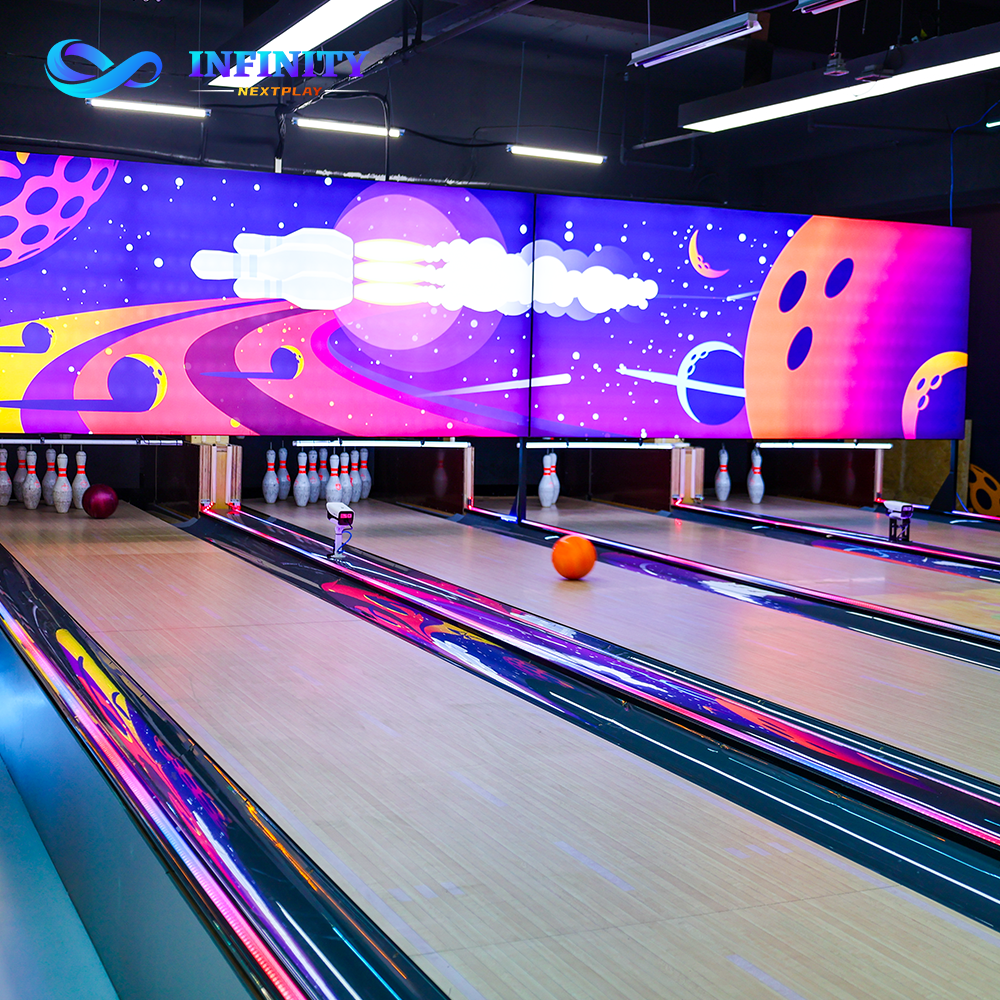
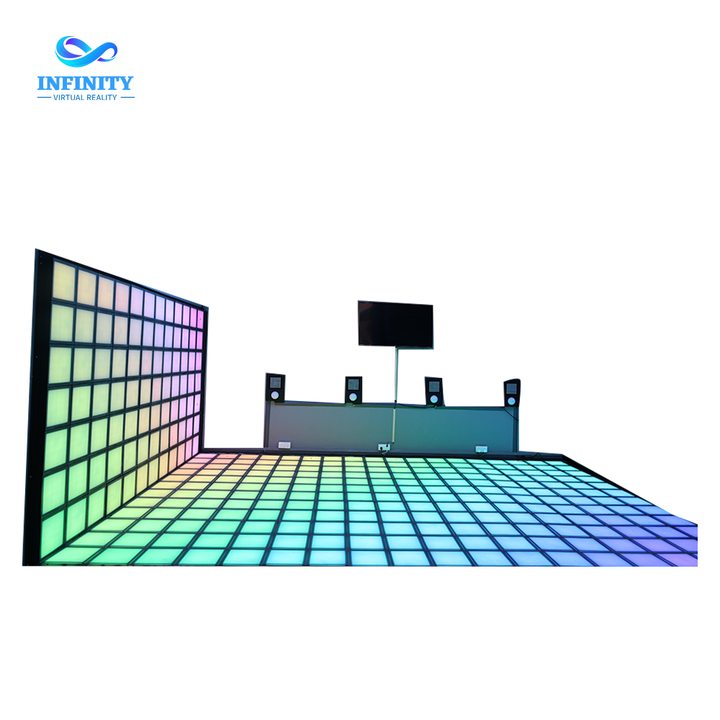
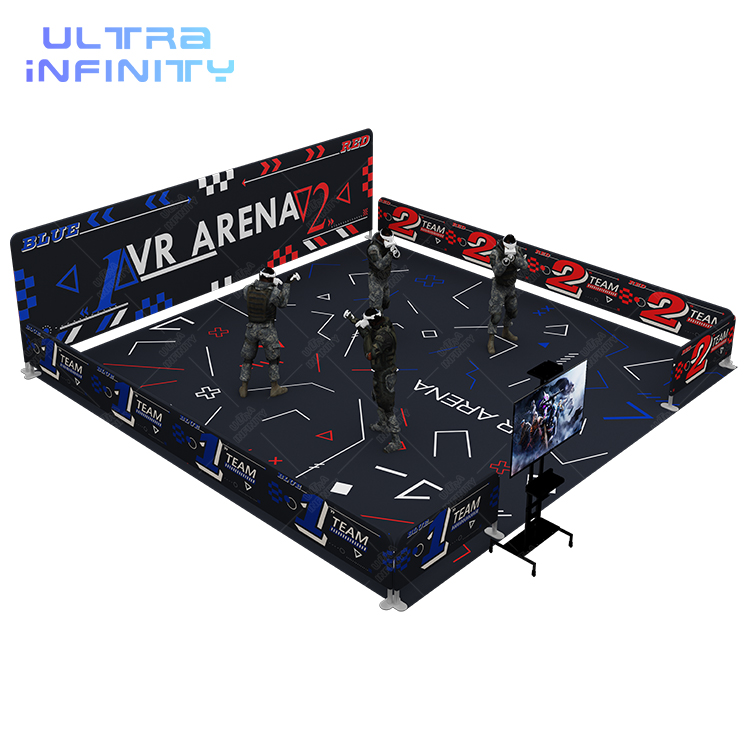
Picture the published figures assembled into one 2026 opening. The operator enters at the published $30K duckpin package - $40-48K all-in - and opens two categories on a compact floor. The zone stack reserves the published ~15% for circulation, and the multi-activity demand the published 57% documents fills it: the Standard 10-Pin Bowling pair anchors, the Infinity Grid LED Floor runs the party layer, the Free Roaming VR Arena 2.0 holds groups the published 40 extra minutes. The leaderboard system drives the published 60% repeat lift; the spectator wall lifts beverages 25-35%; the weekday calendar books schools and leagues at the published rates. Revenue climbs the curve toward the published $88-135 per square meter ceiling, and the payback lands inside the published 14-18 month window.
The scenario is illustrative, but every number in it is a published reference: the entry budget, the zone shares, the demand split, the retention multipliers and the revenue ceiling.
Every figure here is a published planning reference: the 57%/17% multi-activity split comes from the published KAM Insight research (n=600); the $30K entry package and $40-48K opening come from the published budget ladder; the 60% repeat lift and 40-extra-minute dwell come from the published retention and dwell studies; the $320/hour test comes from the published attraction analysis; the 72% viewing share and 25-35% beverage lift come from the published spectator-screen study; the weekday program rates come from the published off-peak playbook; and the $88-135/m2 ceiling and 14-18 month payback come from the published revenue and budget models. All are planning references, not guarantees - restate each against your own market before adopting them.
The questions venue planners ask about the 2026 trend list, answered with the published references.
The multi-activity floor. The published research (57% of competitive-socialing visitors prefer venues with multiple activities against 17% for single-activity) is the demand side of the zone-stack model - single-attraction venues are swimming against a measured majority preference.
The published budget ladder phases it: a $30K four-lane duckpin entry package opens at $40-48K total, and the compact build pays back in the published 14-18 month window before any expansion.
The published attraction test prices every candidate by revenue per booked hour - the trend is toward attractions that clear that bar in more dayparts, which favors linked multiplayer and programmable formats over one-shot rides.
The published screen analysis measures 72% of queue guests watching the wall and a 25-35% beverage lift - the screen converts waiting into revenue, which is the operating trend behind the display spec.
The published dwell-time study shows free-roam arenas holding groups 40 extra minutes and the repeat analysis ties leaderboards to 60% higher return rates - the trend has moved from novelty hardware to retention systems.
The published off-peak playbook: school blocks at $300-600 and league nights at $400-600 - structured demand the venue schedules rather than waits for.
Send us your footprint and budget phase: we will return the zone stack, the trend-adoption sequence and the revenue projection through the free 3D layout design - anchored with the Standard 10-Pin Bowling, the Infinity Grid LED Floor or the Free Roaming VR Arena 2.0.