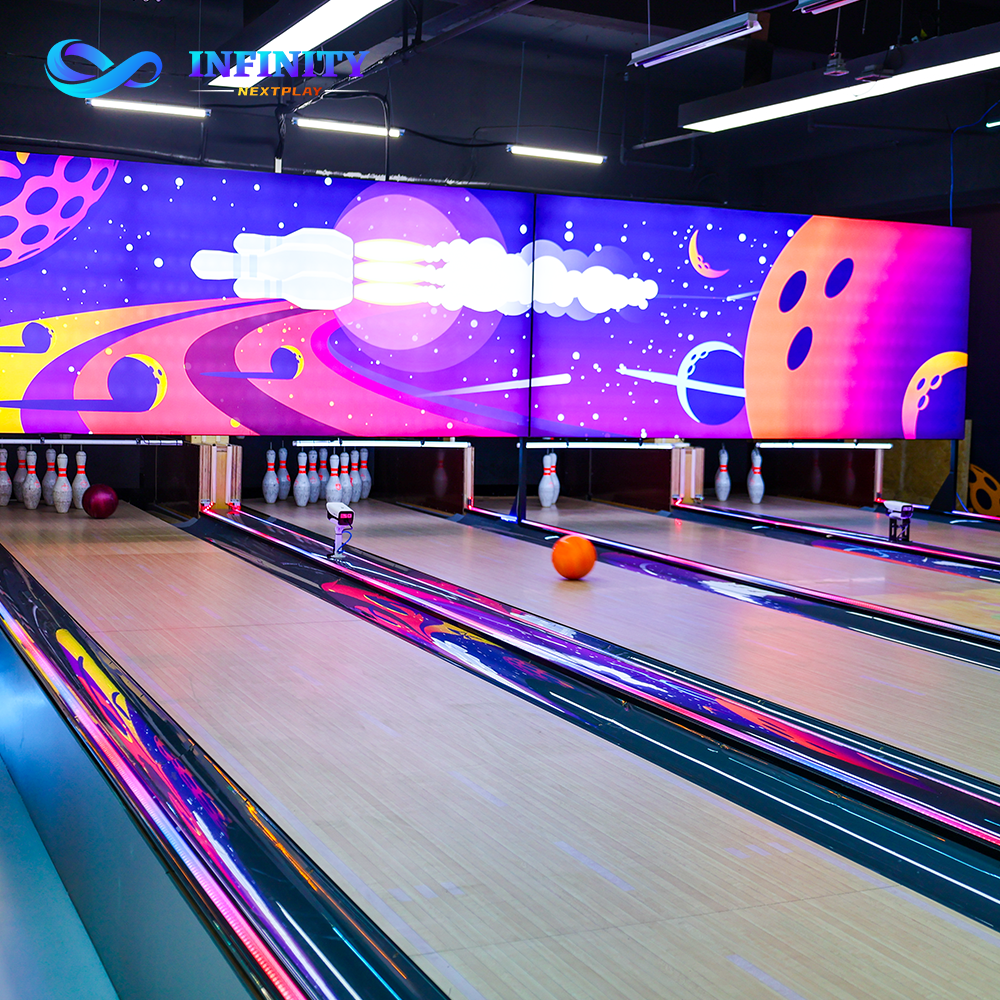
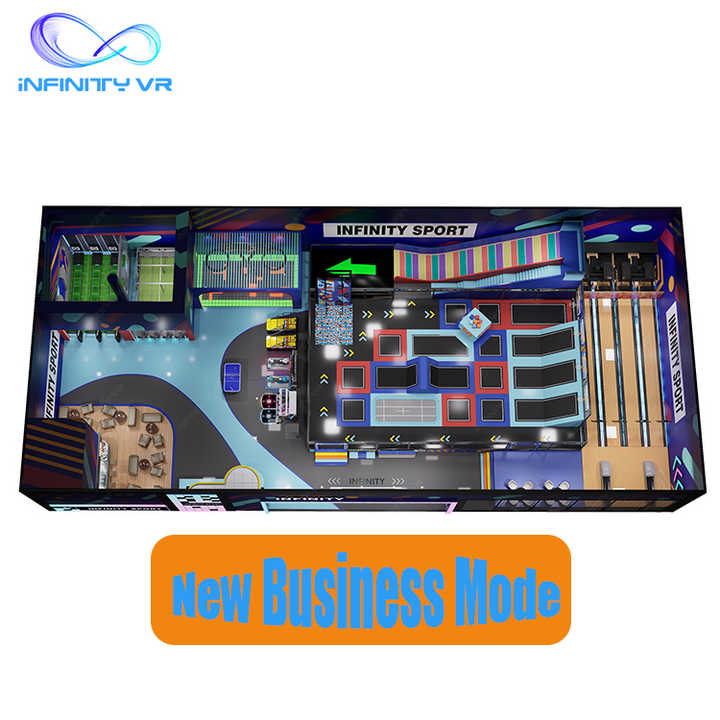
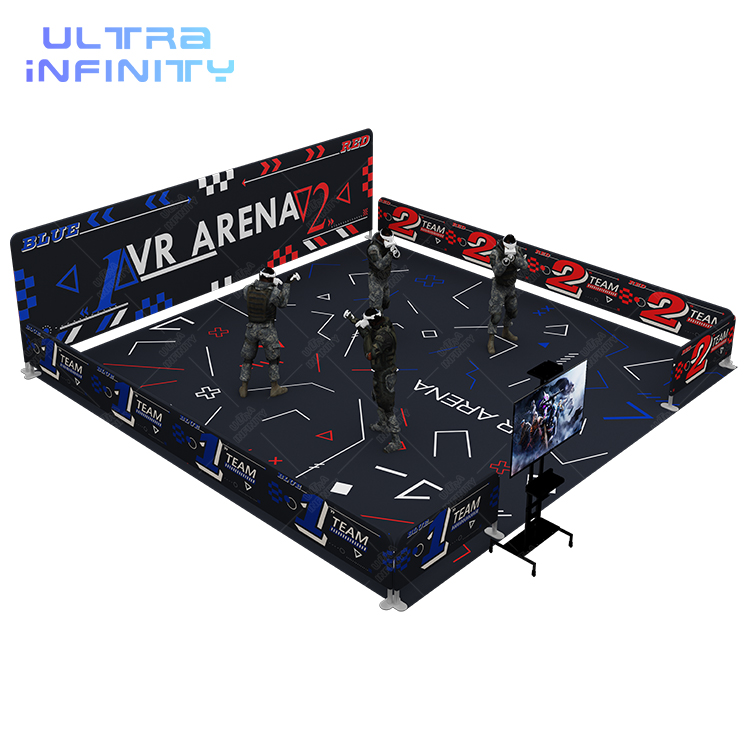
This package is a single-supplier engineering scope for a 2,800 square-meter flagship venue that combines four revenue zones under one cloud POS: an 8-lane 10-pin bowling alley with string pinsetters, six interactive LED grid challenge rooms, a free-roam multiplayer VR arena, and a gastropub dining deck. One contract covers equipment manufacturing, a custom 3D floor plan, on-site installation supervision, staff training and the integrated wristband/POS software.
The point of a turnkey scope is to avoid the fragmentation that derails multi-vendor projects: mismatched power requirements, incompatible ticketing systems, staggered shipping, and finger-pointing during commissioning. When the lanes, the tiles, the arena tracking and the POS come from one engineering team, the integration work is designed once instead of renegotiated on site.
This guide is written for investors and operators planning a 2,000 to 3,000 square-meter flagship, and for distributors assembling a full-venue proposal for a client. Every price band below either carries a published first-party source you can open, or is marked quote-based. The revenue model in Section 5 is an example you rebuild with your own local numbers, not a projection of your market.
The floor divides into four operating zones plus circulation, lobby and back-of-house. The zone matrix below is the reference layout used in the custom 3D plan; dimensions for each zone are targets that get confirmed against your structural drawings before manufacturing freezes.
| Zone | Reference Footprint | Core Systems | Throughput Band (players/hr) |
|---|---|---|---|
| 10-pin bowling (8 lanes) | 26 m lane deck, 8 lanes | String pinsetters, overhead scoring, glow channels | 96–160 |
| LED grid challenge rooms (6) | 25 m × 15 m combined | Pressure-sensor glass tiles, RS485 control, leaderboards | 180–270 |
| Free-roam VR arena | 18 m × 12 m | Optical tracking, wireless headsets, haptic blasters | ~24 |
| Gastropub + VIP deck | Shaded lounge area | Booths, RFID kiosks, taproom, trophy wall | ~100 seated |
Throughput bands are realistic operating ranges, not marketing peaks. A 26-meter lane turns over roughly 12 to 20 players per hour depending on group size; each LED chamber hosts about 30 to 45 players per hour on short challenge rounds; a free-roam arena running 4-player rounds at about six rounds per hour serves around 24 players per hour (see the published arena comparison for the session math). Composite peak throughput across all zones lands near 400 to 550 players per hour, which is the number to plan staffing and wristband capacity around.
The bowling lanes and LED rooms install on custom steel leveling sub-frames over the concrete slab without chemical anchors, so the floor stays removable for leased properties that prohibit permanent fixing. Overhead scoring screens, the VR tracking cameras and the leaderboards all mount to structure or the sub-frame system specified in your layout.
Three product lines carry the venue. The Standard 10-Pin Bowling Alley (26 m lane) in this plan uses motorized string pinsetters, which is the configuration decision that moves capital cost the most (explained in Section 4). The Custom Interactive Sportainment Equipment (Infinity Grid LED) builds the six challenge rooms as modular pressure-sensor tile chambers with cloud leaderboards. The Free Roaming VR Arena 2.0 provides the wireless multiplayer walking arena with optical positioning and haptic blasters.
The fastest way to get a full-venue budget wrong is to treat it as one number. The honest way is a breakdown: which lines carry published price anchors, which lines are quote-based, and which single configuration choice moves the total the most.
That configuration choice is the pinsetter. A 26-meter lane with automatic pinsetters prices in the $58,000 to $75,000 per lane band. The same 26-meter 10-pin format with string pinsetters prices in the $11,000 to $16,500 per lane band, about a quarter of the automatic band. This plan uses the string-pinsetter configuration. The full per-lane breakdown, including what changes at volume, is published in How Much Does a Bowling Lane Cost? The Per-Lane Price Breakdown.
| Cost Line | How It Is Priced | Planning Range (USD) |
|---|---|---|
| 8 × 26 m 10-pin lanes, string pinsetters (equipment) | Published band $11,000–$16,500 per lane | $88,000–$132,000 |
| Installation and commissioning | Published $950 per lane (string format) | $7,600 |
| Freight, bowling package | Published small-package band $1,500–$3,500; eight 26 m lanes typically sit at or above the top | $3,500–$8,000 |
| LED grid challenge rooms (6 modules) | Quote-based. A published boutique-venue LED floor installation benchmark is $28,000 per zone-scale install; pressure-sensor challenge modules typically price above a plain dance floor. Request an itemized quote per module. | Quote-based (one of the larger lines) |
| Free-roam VR arena, flagship multiplayer config | Published two-pod reference $28,000–$34,000. Flagship multi-pod arenas scale with pod count and tracking area; quoted per configuration. | Quote-based (2-pod floor reference $28K–$34K) |
| Gastropub fit-out and VIP deck | Local contractor scope: bar, kitchen rough-in, seating, decor | Quote-based |
| Cloud POS, RFID wristbands, training | Package scope line, confirmed in the quotation | In package quote |
For tier context, the published FEC budget guide covers venue classes from a 400 to 600 m² boutique at $25,000 to $40,000 total capital up to landmark complexes above $250,000, and the compact six-lane reference build in the sportainment earnings model lands between $185,000 and $240,000. A 2,800 m² flagship with eight bowling lanes, six LED rooms, a VR arena and a gastropub fit-out sits in a higher tier than any of those references; the itemized quote is the number to underwrite, and the FEC budget guide is the right ladder to place it on.
The model is built bottom-up: disclosed inputs produce monthly revenue, monthly revenue minus disclosed cost lines produces an operating margin, and a stated all-in project cost divided by that margin produces a simple payback window. No line is invented to make another line work.
| Input | Example Value | Replace With |
|---|---|---|
| Weekday paying visits per day | 380 | Local market research |
| Weekend paying visits per day | 920 | Local market research |
| Weekdays / weekend days per month | 22 / 8 | Your operating calendar |
| Blended play rate | $28 per player-hour | Your pricing study |
| Average paid play per visit | 0.55 hours (33 min) | POS data after opening |
| Share of visits buying F&B | 40% | Your POS data |
| Average F&B ticket | $14 | Your menu pricing |
| Line | Math | Amount |
|---|---|---|
| Paying visits | 380 × 22 + 920 × 8 | 15,720 |
| Play revenue | 15,720 × 0.55 × $28 | $241,728 |
| F&B revenue | 15,720 × 40% × $14 | $88,032 |
| Total gross revenue | Sum | $329,760 |
| Yield check | $329,760 ÷ 2,800 m² | $118 / m² / month |
The yield check is the honesty test. The published sportainment earnings model puts worked venue yield at $88 to $135 per square meter per month of attraction area, with target payback of 7.2 to 8.5 months on a 2,000 m² build. The example above lands at $118 per m², inside that band. If your rebuilt inputs push yield far outside the band, revisit the inputs before trusting the output. The band source is What Does a Sportainment Center Earn? The $88/m² Model Behind 4 Categories, and a smaller-format first-year ledger with the same discipline sits in the 600 m² active lounge payback timeline.
| Cost Line | Basis | Amount |
|---|---|---|
| Rent | 2,800 m² × $10 / m² | $28,000 |
| Labor with employer costs | Example flagship roster (floor, bar, kitchen, managers) | $115,000 |
| F&B cost of goods | 28% × $88,032 | $24,649 |
| Utilities, insurance, marketing, maintenance, software | Example flagship bundle | $25,000 |
| Total operating costs | Sum | $192,649 |
| Monthly operating margin | $329,760 − $192,649 (before debt service, owner salary, tax) | $137,111 |
| Margin share of gross | $137,111 ÷ $329,760 | 42% |
Simple payback is all-in project cost divided by monthly operating margin. If your itemized quote for equipment, LED rooms, VR configuration, freight, install, F&B fit-out, working capital and contingency totals $1,000,000, and the example margin holds:
That lands inside the 7.2 to 8.5 month target band published in the sportainment earnings model. Swap in your real quote and your real margin and the formula gives your real window. A financed build adds monthly debt service, which lowers the cash margin and extends the window; a slower opening ramp does the same in year one, which is why the 600 m² ledger models an opening ramp separately from the steady state.
On the F&B line specifically: group bookings, leagues and corporate buyouts lift beverage attachment when the floor gives people a reason to stay. One Madrid sports bar published a 42% F&B sales lift after adding indoor baseball and digital shooting simulators; treat that as a case reference to study, not a promise your venue will match. The case is Madrid Sports Bar Boosts F&B Sales 42%.
The delivery sequence is designed so manufacturing starts only after the layout is frozen, and on-site work starts only after the site passes a readiness check:
Your side of the line: civil works and slab prep, the electrical drop to each zone, network infrastructure, local licenses, rent, working capital and F&B inventory. Confirm which of these sit with your general contractor versus your own operations team before the install window is booked.
The example model is stable arithmetic on unstable inputs. Four inputs move the payback window more than any others, and each one is a local decision you control:
Rebuild the model with your four numbers before you present it to an investor or a bank. The structure stays the same; only the inputs change.
About 4.2 meters clear is the working assumption for overhead bowling screens and VR tracking coverage across all zones. Confirm the number against your structural drawings before the layout freezes; mezzanine or truss conditions can change it zone by zone.
Bowling lanes and LED tile rooms rest on steel leveling sub-frames over the concrete slab without chemical anchors, so the installation is removable without cutting or drilling the slab. This is a structural design feature of the sub-frame system, not a finish warranty; confirm the removal method with your landlord before signing the lease.
A venue of this mix typically runs on a three-phase supply. The exact kW figure depends on the final equipment list and local voltage; it is confirmed in the electrical drawing issued with your layout, not quoted here as a fixed number.
Yes. The cloud software syncs player rankings and tournament scores across multi-city venue networks in real time, which matters if you are planning a second site from day one.
Warranty and support terms are confirmed per order in writing. Request the warranty document that applies to your specific equipment list, coverage period and exclusions before purchase; website overviews are introductions, not contract terms.
Send your floor area, clear height and any existing floor plan. The project team returns a custom 3D layout with zone-by-zone equipment placement and an itemized quotation that separates the anchored lines (bowling equipment, install, freight) from the quote-based lines (LED rooms, VR configuration, F&B fit-out), so the number you take to your investors is built the same way the model in this guide is built.
Model inputs in this guide are examples for planning discipline, not revenue guarantees. Final CAPEX, throughput and payback depend on your quote, your market and your operating choices.