Every multiplayer VR arena runs on a paradox: the machine plays four people, but the money walks in as a crowd. The queue, the parents, the friends who came along, the mall passerby - none of them wear a headset, and most of them were never counted as revenue. The published spectator-screen analysis measures what happens when the arena casts the game to a wall: 72% of queue guests watch the screen, and beverage revenue runs 25-35% higher than identical arenas without one. Watching is not dead time - it is the trial run, and the screen is the salesperson. This playbook turns that audience into players and that dwell into bookings.
The published configuration runs three spectator screens per arena, each with a different job. The replay wall faces the queue and runs the live cast - this is the screen that holds the 72% viewing share. The leaderboard board sits on the exit path, where the standings do their repeat-visit work: the published repeat-rate analysis attributes a 60% higher repeat rate to leaderboard and team systems, with returners playing 2-3 sessions per visit and 30% coming back weekly. The third screen doubles as the counter-side dwell driver, where the published drink lift of 25-35% lands.
| Screen | Position | Job | Published Effect |
|---|---|---|---|
| Replay wall | Facing the queue | Live cast + post-match replay | 72% queue guests watch |
| Counter-side screen | Food/beverage counter | Hold dwell at the register | 25-35% beverage lift |
| Leaderboard board | Exit path | Standings + rematch booking | 60% higher repeat rate |
The published dwell-time study maps the post-match window precisely: groups stay at the arena edge for five to ten minutes arguing over who won, watching the replay and planning the rematch. That argument is the conversion moment, and the playbook is to staff it: the host walks to the edge group with the tablet while the replay loops - the rematch books at the peak of the argument, not at the register afterwards. Inside the published machine cycle of four players per round at six rounds per hour, each converted spectator fills the next open slot instead of leaving the arena running three-handed.
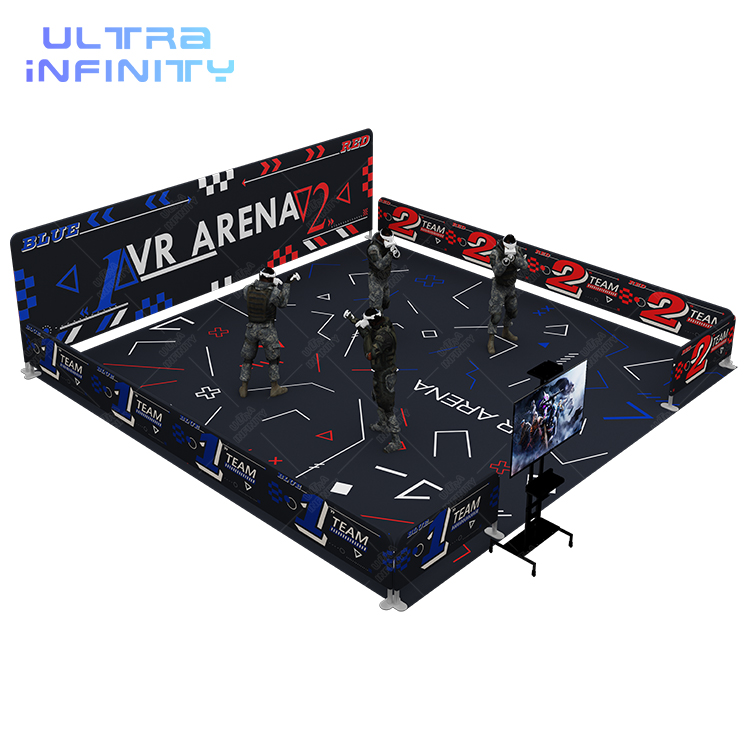
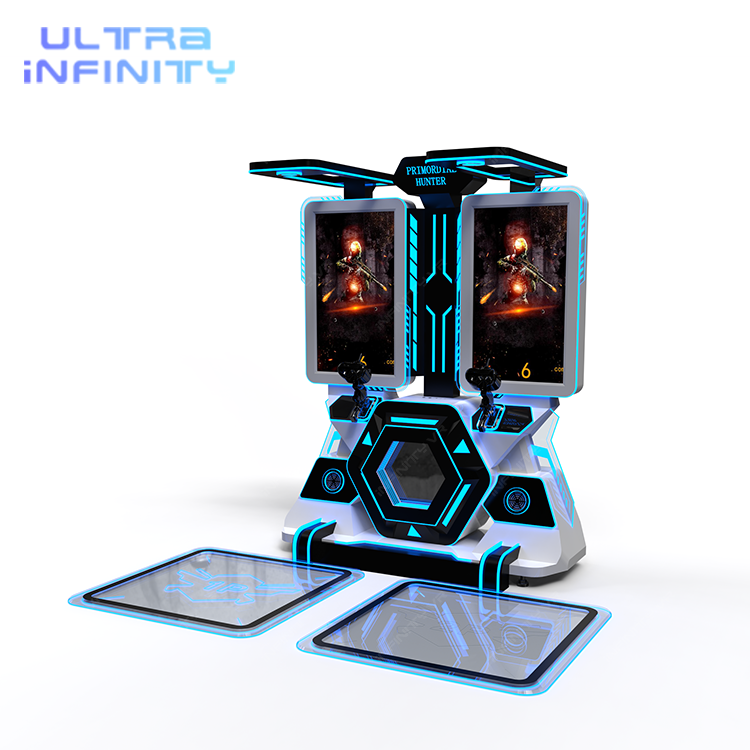
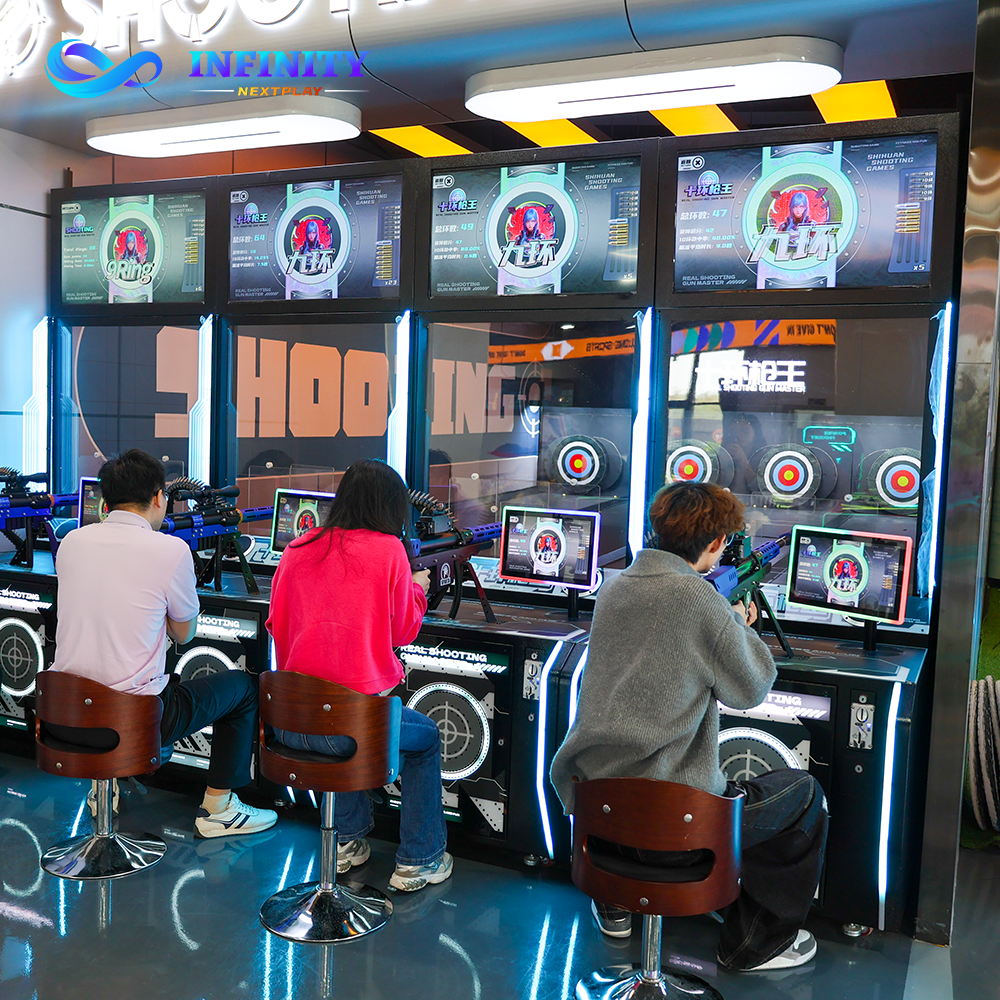
Two products complete the funnel. The Free Roaming VR Arena 2.0 is the cast centerpiece - four-player walking combat reads perfectly on a wall, which is why the format headlines the replay wall. The VR Battle Shooting Simulator converts in pairs - two headsets, two spectators who now both know the game, doubling the pool of briefed players per cycle. For guests who refuse the headset entirely, the Digital Scoring Shooting Simulator Q4 keeps them on the same leaderboard without one - the on-ramp the published rewards system was built for.
The conversion funnel only pays if the price ladder behind it is coherent, and the published references already define it. The walk-in session ticket runs the published $12-18 band per player - the price a queue spectator steps up to after watching two rounds. Group bookings follow the published per-group packages of $100-220 for four to ten players, which convert the family audience standing in the same queue. Weeknight regulars graduate to the published $25-30 single league fee, and corporate spectators convert at the published $28-42 per-person package tiers. Each rung prices a different depth of conversion - watch, play, book, bring the team - and the spectator wall feeds all four.
| Conversion Rung | Published Price | Who Converts There |
|---|---|---|
| Walk-in session | $12-18 per player | Queue spectators after two watched rounds |
| Group package | $100-220 per group (4-10 players) | Families and friend groups watching together |
| League fee | $25-30 per player | Weekly regulars off the leaderboard board |
| Corporate package | $28-42 per person | Event planners scouting from the counter |
Picture the published figures assembled into one Saturday. The replay wall casts every arena round; per the published 72% viewing share, twelve of the sixteen people in the queue are watching. A four-player match ends; the group spends its published five-to-ten-minute edge window replaying the final firefight, and the host books the rematch before the loop ends. At the counter, the published 25-35% beverage lift lands as the watchers order what they saw the players order. On the exit path, the leaderboard board shows the Saturday standings - and per the published repeat analysis, the guests who saw their names on it are the 30% who come back next week.
The scenario is illustrative, but every number in it is a published reference: the viewing share, the edge-argument window, the beverage lift, the repeat rate and the returner share.
Every figure here is a published planning reference: the 72% queue-viewing share, the 25-35% beverage lift and the three-screen configuration come from the published spectator-screen analysis; the five-to-ten-minute post-match edge window comes from the published dwell-time study; the 60% repeat-rate lift, 2-3 plays per visit and 30% weekly-returner share come from the published repeat-rate analysis; the four-player, six-rounds-per-hour machine cycle comes from the published multiplayer guide; and the concourse crowd-draw effect of visible motion play is documented in the published mall footfall study of 360 rotating VR chairs tripling concourse footfall. All are planning references, not guarantees - restate each against your own floor and queue before adopting them.
The questions venue operators ask about casting and conversion, answered with the published references.
The published spectator-screen analysis measures 72% of queue guests watching the wall display. That watching time is the conversion inventory: a guest who watches two full rounds sees exactly how the game works, which is the sales pitch no poster can deliver.
The published comparison reports operators running a spectator wall at 25-35% higher beverage revenue than identical arenas without one, and the headline 30% drink-sales lift comes from converting dead wait time into dwell time next to the counter.
The published dwell-time study finds groups stay at the arena edge for five to ten minutes arguing over who won and watching the replay on the spectator screen - the post-match window is when the rematch decision happens.
The published repeat analysis puts arenas with leaderboard and team systems at 60% higher repeat rates, 2-3 plays per visit, and a 30% weekly-returner share - the screen that shows the standings is also the screen that books the next visit.
The published configuration runs three spectator screens per arena - the replay wall facing the queue, the live-cast screen above the arena, and the leaderboard board at the exit path.
Yes - the published Q4 digital scoring shooting simulator runs real-time leaderboards and rewards on-screen, which lets the non-headset half of a group compete on the same scoreboard between VR rounds.
Send us your arena footprint and queue layout: we will return the three-screen placement, the cast configuration and the conversion path through the free 3D layout design - anchored with the Free Roaming VR Arena 2.0, the VR Battle Shooting Simulator or the Digital Scoring Shooting Simulator Q4.