Ask the open web whether indoor mini golf is profitable and you get confident answers that contradict each other: margins of 20 to 70 percent beside an industry median of 17 percent, payback in one to three years beside three to five, throughput of eighty to a hundred guests an hour beside sixteen. Both sets are published, and the reason they disagree is that they measure different businesses - different denominators, different inclusions, different assumptions - and almost none of them say so. This page is the adjudication: every major public claim, who published it, what denominator it uses, and how much weight it deserves, set against the first-party ledger of numbers we publish for indoor venues. The verdict is not a single figure. It is a framework for reading every figure, including ours.
Yes, venues make money - and no, the published numbers do not agree on how much or how fast, which is the real answer to the question. A margin is not a property of mini golf; it is the output of a model with inputs: the ticket, the days, the utilisation, what share of revenue is counted, and whether the land, the build-out and the owner's labour are in the cost line. Change any input and the same room moves bands. So before quoting a figure - anyone's, including ours - you owe the model a look.
The headline claims on the open web, laid out with their sources and their problems:
| Source | The claim | What it is measuring | Initial verdict |
|---|---|---|---|
| ROLLER (venue software blog, 2025) | Margin 20-70%; payback 1-3 years; start $300K-1.5M | All-in venue economics, wide band, mixed indoor/outdoor | Reference band only - the width signals mixed inputs |
| LegalClarity (legal guide, 2026) | Margin 20-40%; payback 3-5 years; 80-100 pax/hr peak | Outdoor-leaning examples; theoretical peak throughput | Conflicts with ROLLER; peak throughput is not schedule throughput |
| IBISWorld / IRS via Startup101 | U.S. industry $441.6M; average operating margin 17.05% | Whole U.S. industry, dominated by outdoor courses | The realistic median anchor - T1 data, reported by |
| FinancialModelsLab (modelling site) | $600K annual revenue -> $89,760 owner income | Outdoor single-owner model with published line items | The most auditable external model; indoor needs a labour rewrite |
| Our first-party ledger | Ladder $17,160-$53,040+/mo; payback 9-14 / 18-30 / 6-12 mo | Indoor venues, utilisation-varied, equipment-tier costs | Checkable line by line against the guides we publish |
The three numbers worth carrying out of this section: the industry's own median operating margin is 17.05 percent as reported from IRS-sourced figures - far below the marketing bands; the payback range in circulation spans one to five years depending on who is writing; and the only indoor-specific margin figures published with assumptions attached are ours, which is a gap in the category rather than a boast. Everything below unpacks those three.
How to read the rest of this page: section two adjudicates the margin claims, section three the payback claims, section four the two denominators that make most cross-source comparisons meaningless, section five lines the outside claims up against our own ledger, and section six converts the whole exercise into five questions you can run on any model - ours or a competitor's - before signing. Our own ROI method page is the arithmetic companion if you want to rebuild any of these numbers yourself (indoor mini golf ROI: calculating investment return in three numbers).
Four margin figures circulate, and they are not four measurements of one thing. ROLLER's 20 to 70 percent is a range so wide it functions as a reference band rather than a result: the bottom is a lean outdoor loop and the top is a themed venue with attached spend, and nothing in between is specified. LegalClarity's 20 to 40 percent narrows it for a different sample. The 25 to 40 percent band from a small-business startup guide adds a third opinion with no visible methodology change. And then there is 17.05 percent.
The 17.05 percent figure is different in kind from the others. It is reported from IRS statistics on the whole U.S. miniature golf industry - an industry dominated by outdoor, seasonal, owner-operated courses - and it is a median outcome rather than a projection. Nobody was selling anything when it was computed. Read together, the honest statement is: 20 to 70 percent describes what the best venues can do; 17.05 percent describes what the average venue in the country does do; an indoor operator planning a new room should believe both, with the first as upside and the second as the floor test.
One more external model deserves its own line because it is the rare transparent one: FinancialModelsLab publishes an outdoor 18-hole owner model with every row visible - $600,000 annual revenue converting to $89,760 of owner income, a stated 90 percent non-labour gross margin, and a monthly break-even near $37,800. The model is auditable, which earns it more weight than the bands above, but it is an outdoor self-operated single-owner case: an indoor venue replaces the labour line and inherits the equipment tiers instead, so its structure transfers while its absolute numbers do not.
Cross-validation exists at the revenue line even where it fails at the margin line: an industry compilation puts average annual venue revenue at about $450,000, and the IRS-derived average in the Startup101 reporting sits at $480,522 - two independently produced numbers in the same neighbourhood. That convergence tells you the top line is reasonably knowable. It tells you nothing about your margin, because both samples are outdoor-weighted and margin is where the indoor/outdoor and owner/operated differences live.
What is missing from the public record is stated here rather than filled in: no published source gives a margin figure specific to indoor mini golf venues. Every indoor margin in existence is either a first-party model (ours, below) or an extrapolation. A planner who is told indoor margins are 60 percent has been told someone's upside case with the assumptions removed. The method for building your own is on our calculation page - three numbers in, one answer out (the three-number ROI calculation method).
Payback is where the public answers diverge hardest: one to three years from ROLLER and its near-neighbours, three to five years from LegalClarity, and a set of first-party bands from our own published scenarios that do not agree with either because they are cut differently. When two credible-looking sources three years apart on the same question are both published, the problem is not that one is lying - it is that neither states its method.
Decompose a payback figure and every disagreement resolves into inputs. What is in the start cost: land and build-out or equipment only? ROLLER's $300K-to-$1.5M start range is explicitly the all-in outdoor-to-themed-indoor span, which is a different object from an equipment-plus-installation quote. What utilisation does the revenue line assume: a ramp year, a steady state, or a best case? And what is counted as return: gross revenue, operating profit, or owner income? A 1-to-3-year claim built on gross revenue is not the same claim as a 3-to-5-year one built on net profit - they can describe identical businesses.
| Payback claim | Source and grade | Denominator it appears to use | Adjudication |
|---|---|---|---|
| 1-3 years | ROLLER 2025 and a cluster of T2 pages citing the same chain | Unstated; likely gross-revenue-leaning, all-in capex | No published methodology - treat as marketing-adjacent band |
| 3-5 years | LegalClarity 2026, T2 legal guide | Owner-income framing, unstated utilisation | Plausible for conservative cases; method also unstated |
| 9-14 months (typical), 18-30 months (conservative design), 6-12 months (compact 9-hole 300 m²) | Our first-party ledger, published guides | Equipment-tier capex; utilisation-varied ticket revenue; stated assumptions | Checkable: each band names its inputs in the guide that produced it |
The three first-party bands are not a single promise at three comfort levels - they are three different rooms. The 6-to-12-month band belongs to a compact nine-hole 300 square metre configuration with a small cost tier; the 9-to-14 band is the typical indoor reference scenario; the 18-to-30 band is what a design-heavy build with premium theming produces. Quoting any of them without its room is exactly the error this page is adjudicating in everyone else, so the rules hold for our numbers too: band, inputs, or it did not happen.
Two supporting pages carry the detail rather than being restated here: the payback-by-hole-count work for the compact configuration (when does a mini golf course pay back in a 300 m² FEC) and the construction-cost guide for what sits in the start number (how much does an indoor mini golf course cost). The adjudicated conclusion of this section fits in one line: payback is an interval with assumptions attached, and any source giving you a single number without them has skipped the step that matters.
One honest admission about our own bands: they are modelled from published inputs, not audited cohort results. They carry more weight than the external bands because the inputs are visible, and less than a set of bank statements, because they are. The next step for any planner is to replace the inputs with their own - ticket, days, utilisation, cost tier - which is the five-question framework in section six.
Two comparison errors account for most of the confusion in this category, and both are denominator problems. The first is throughput. LegalClarity publishes a peak of 80 to 100 guests per hour for an 18-hole course; our capacity guide publishes 16 to 24 players per session hour for one staffed course. Both can be right: the first counts hole positions operating in parallel at theoretical peak - every hole live, every group moving, no queue anywhere - while the second counts a single serial route as a venue actually staffs it, with one group in play per hole at the published 3-to-5-minute rhythm. Put them in one table and you have manufactured a contradiction out of two honest numbers.
The practical rule is simple: never compare throughput figures without their denominator in the same sentence. Peak-hole capacity sizes a staffing plan on a perfect day; serial-route throughput sizes what your schedule can sell. A model built on the first will project revenue your floor physically cannot queue for, and it is the most common reason a pro forma misses in month one.
The second denominator problem is market size. The United States miniature golf industry is reported at $441.6 million with 919 businesses and a five-year growth of 0.4 percent (IBISWorld figures, reported). The global miniature golf centre market is reported at $1.48 billion growing at 6.4 percent annually (market-research publishers, reported). These are not a small number and a big number - they are different geographies and different objects: one is a mature domestic industry of mostly outdoor courses, the other is a global facility category including indoor centres. Combining them in one sentence is a category error, which is why this page keeps them apart.
Scale context comes from the same discipline. The reported U.S. average annual revenue of $450,000 to $480,522 is an outdoor-weighted mixed sample - useful as a floor reference for what a running venue looks like, useless as an indoor target, because indoor venues carry different rent, labour and utilisation structures. Our own revenue ladder exists for exactly this reason: it starts at the ticket and varies the utilisation, so the target is built from your inputs rather than inherited from a sample that never resembled your room. The ladder's full form is in the revenue reality guide (how much your venue can really earn, with the revenue stack).
Cross-category context has one useful form and one useless one. Useful: our own comparison of bowling and indoor golf attractions per square metre, which found the golf side usually wins on revenue per square metre through higher session turnover on a smaller footprint, while bowling wins group size and dwell time (mini golf vs bowling revenue per square meter). Useless: quoting any per-square-metre figure from an unnamed source with a different floor, rent and staffing assumption than yours. And the 2026 economics framing on our own site - the hole as a product, the revenue around it as the business - is the context this whole page sits inside (indoor mini golf economics 2026).
Here is the same territory from our side: published indoor numbers, each one carrying its inputs, lined up against the external claims above. This is the ledger every outside figure should have arrived with.
| First-party line (published, checkable) | Figure | External claim it answers |
|---|---|---|
| Ticket ladder at $12 x 120 x 26, varied by utilisation | $17,160 / $28,080 / $37,440 / $53,040+ per month at 15 / 25 / 35 / 50% | Replaces vague "revenue potential" with four stated scenarios |
| Cost tiers for indoor builds | $50-150K small / $150-350K medium / $350-800K+ premium | Clarifies which object the $300K-1.5M external start range describes |
| Revenue per square metre band | $350-600 per m² per year | Gives the per-m² claim a denominator and a source |
| Payback bands by configuration | 9-14 typical / 18-30 conservative design / 6-12 compact 9-hole | Shows why published paybacks range from 1 to 5 years |
| Attached-revenue layers | Parties +20-40%; corporate buyouts $4,500-7,500; returning guests 40-60% | Locates the "multiple revenue streams" claim in specific lines |
| Throughput as scheduled | 16-24 players per session hour, 3-5 min per hole | Separates sellable throughput from theoretical peak |
Reading the ledger against the adjudications: our margin question is answered not by a percentage but by stacking the cost tier against the ladder at an honest utilisation - the answer arrives as a band with your inputs in it, which is the only form this number can legitimately take. Our payback question is answered by the three configuration bands rather than one figure. And the throughput question is answered with a number a schedule can actually sell.
The claim this ledger cannot answer is the one every comparison needs and no publication provides: how these numbers behave at your specific venue, in your catchment, at your rent. Modelled indoor figures - ours included - are planning instruments. The conversion from instrument to outcome runs through the floor plan, the daypart mix and the local price the market accepts, which is why the closing section asks questions instead of offering a verdict number.
If you want the whole stack in one document rather than across pages, the business plan guide carries the revenue models, cost structure, space and throughput figures, and the ROI math together (mini golf business plan: revenue models, costs and ROI explained). The plan page ties the document to a drawing of a real room (the mini golf course solution page).
The adjudication condenses into five questions. They work on any model - ours, a vendor's, a franchise deck - because they target the inputs where every disagreement in sections two through four originated.
One: what utilisation does this number assume, and what evidence backs it? A margin or payback figure without a utilisation assumption is a claim about someone else's room. Ask for the ramp: which months, what share of the capacity band, and whether the model ever reaches the top of it. Our ladder shows how much the answer moves - the same venue triples its ticket revenue between the 15 and 50 percent rows.
Two: what is in the start cost? Equipment and installation, or land, build-out, furniture and pre-opening? The external $300K-to-$1.5M range spans both objects, and our $50K-to-$800K+ tiers describe the equipment-and-build side with the tier named. Two numbers can only be compared when they buy the same thing.
Three: does the revenue line depend on one ticket? A model showing only rounds is half a business: the same rooms in our ledger carry party layers worth 20 to 40 percent on top, buyouts at $4,500 to $7,500, and a returning-guest share of 40 to 60 percent. A single-stream projection is not wrong, but it is the conservative floor - and it should be labelled as one.
Four: how does the model handle the dead season? The external literature names seasonality as a margin killer; the operational answer is the off-peak programming playbook - early tiers, winter events, group formats - which our winter profitability guide works through in detail (how indoor mini golf stays profitable through winter). Ask what the model does between November and February, and whether the answer is a price, a programme, or a blank row.
Five: what would make you revise the number down? Any source - including this one - that will not name its own failure conditions is selling rather than modelling. The legitimate revisions are legible: utilisation lands under the ramp, the rent sits above the tier, the catchment rejects the ticket. If the answer is instead a guarantee, the guarantee is the problem.
The category's size and maturity (reported at $441.6M across 919 U.S. businesses), the margin bands real venues report (17.05 percent median against 20-70 percent upside cases), the revenue lines a running venue produces ($450-480K averages in outdoor-weighted samples), and the structural fact that payback depends on configuration (one year to five, by inputs).
Which cost tier your room belongs to, how many holes the area holds, what schedule your dayparts support at 16-24 players per hour, the utilisation your catchment will actually pay for, and therefore which of the bands in this page describes your business. That answer arrives as a drawing before it arrives as a spreadsheet.
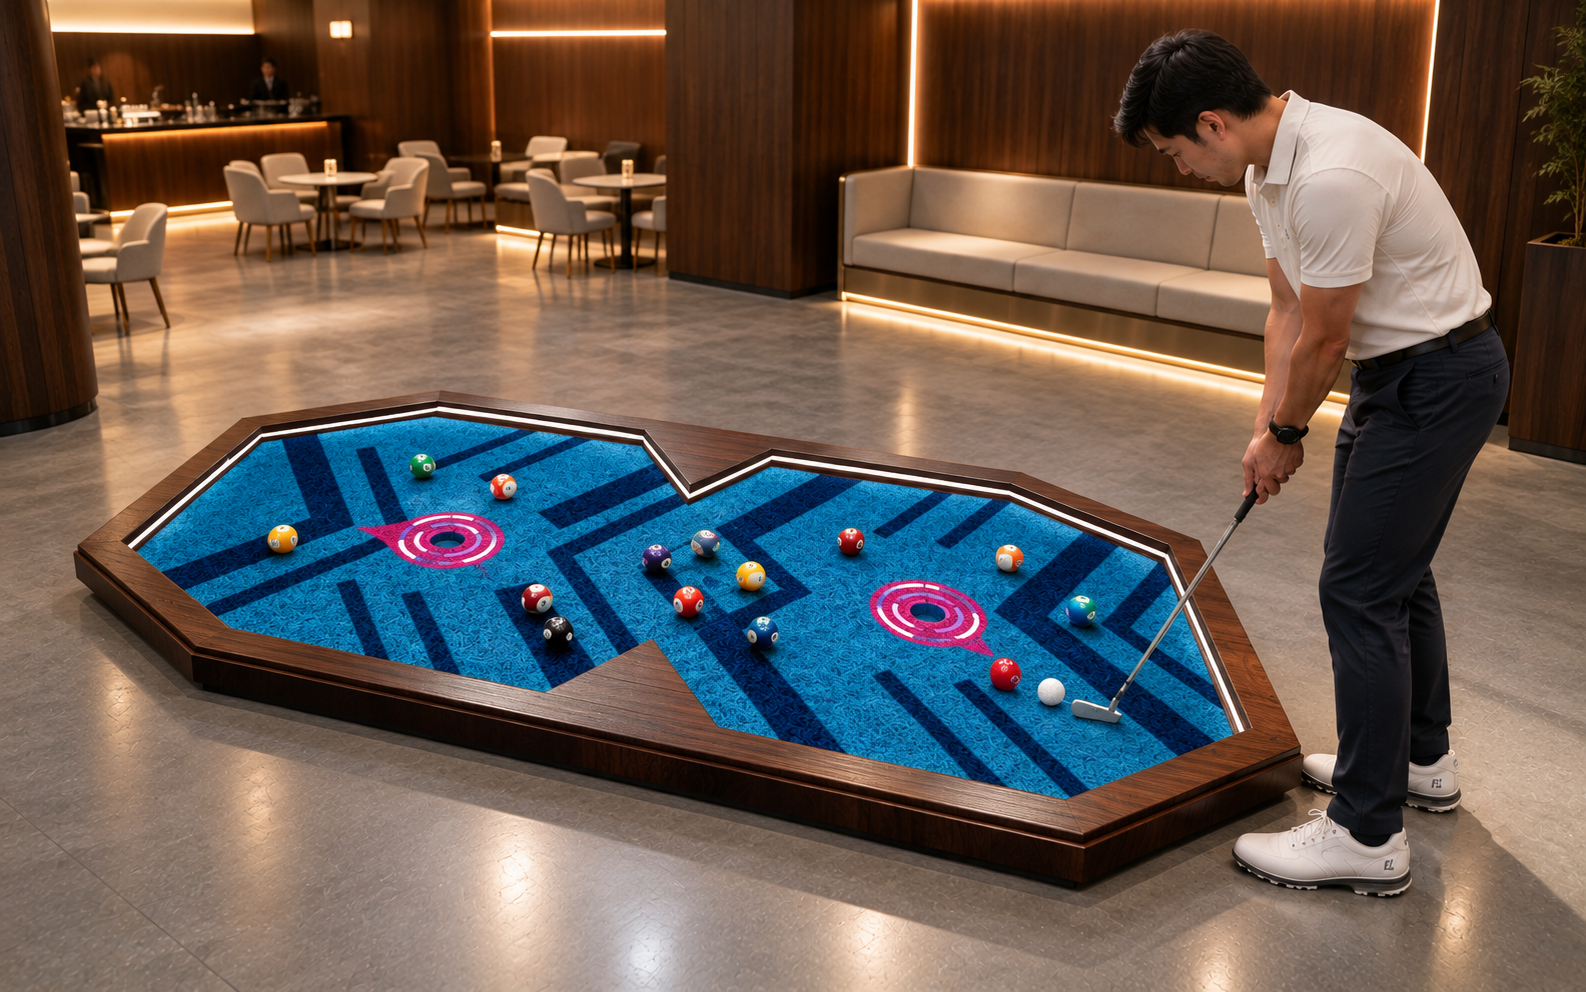
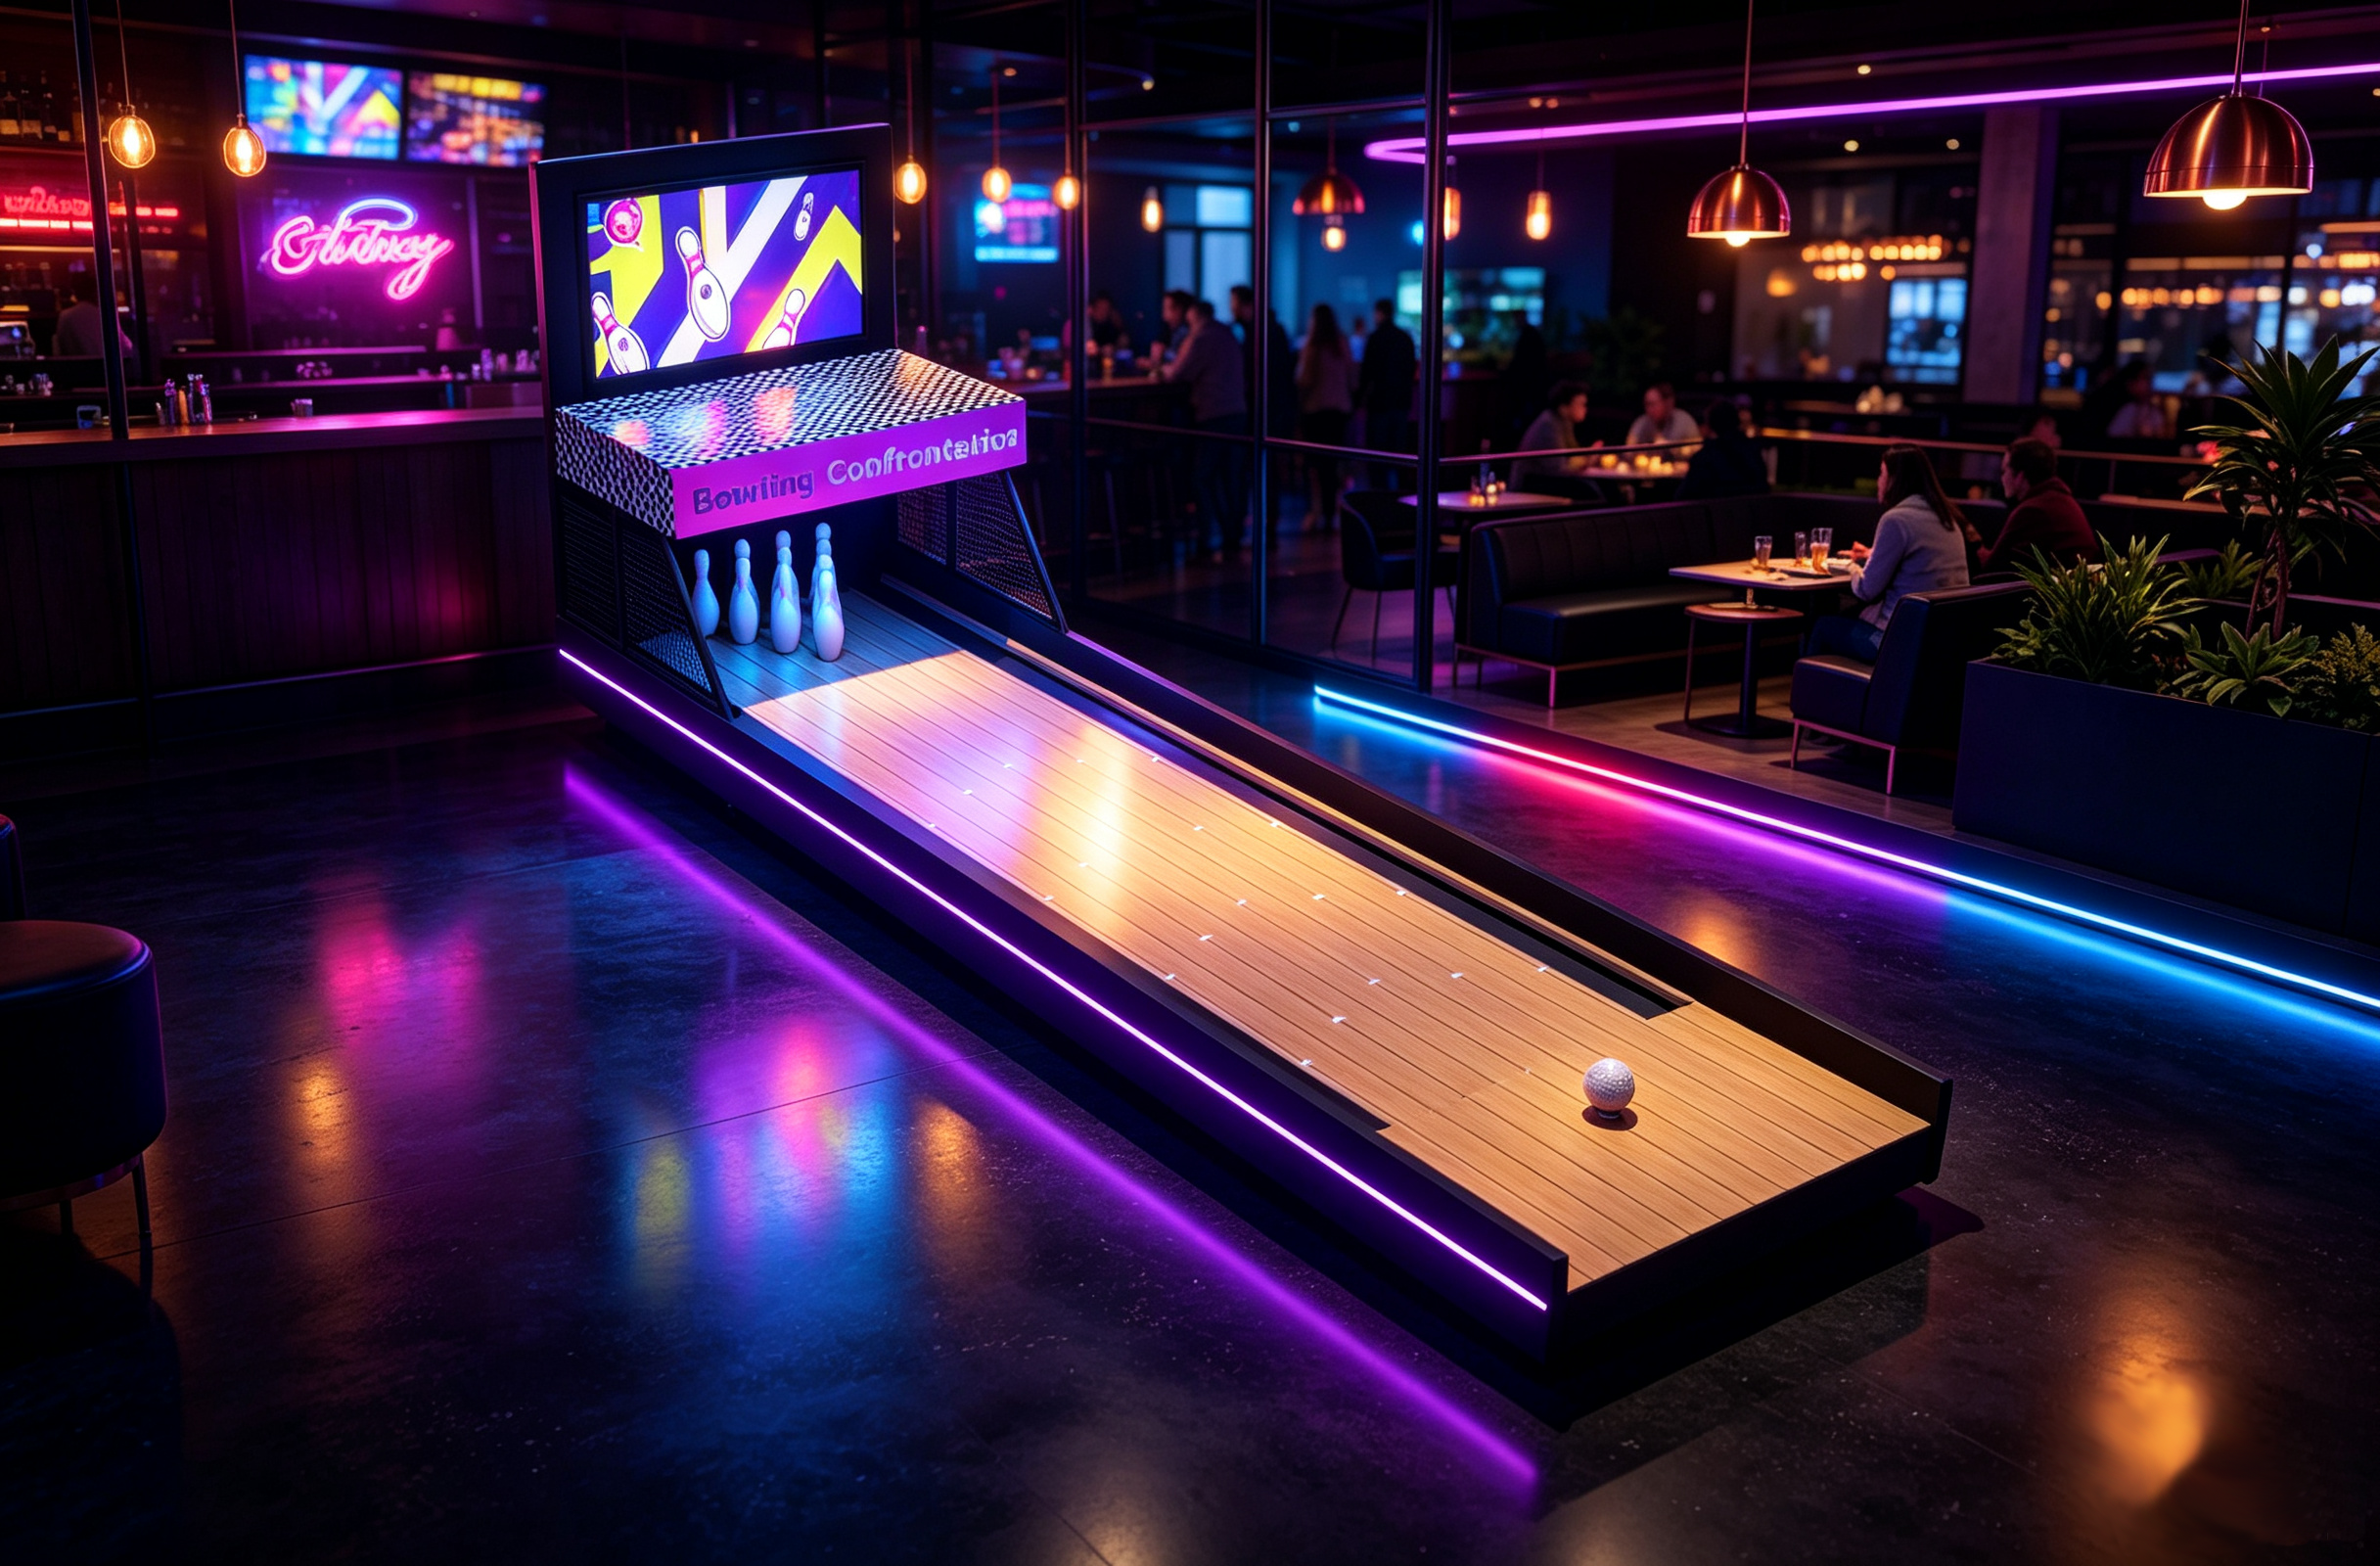
The conversion step between the two columns is a floor plan, and it is deliberately the last thing on this page: the solution page applies the ledger to a room type like yours (the mini golf course solution page), and the free layout pass draws the hole count, queue path and session capacity your utilisation would have to assume (a free 3D layout of your floor). The three units below are the cost-tier variables in that calculation: the Billiard Golf Hole as the cross-mechanism unit that carries a premium tier, the Bowling Golf Hole as the crossover that pairs with food-and-beverage programmes, and the Customized Obstacle Golf Hole as the build-to-budget line that lets the equipment tier flex without changing the room. Profitable is a conditional sentence - the five questions are how you fill in the condition.
Published figures span 17 to 70 percent, and the spread is inputs, not measurement: an IRS-sourced industry median of 17.05 percent (reported via published summaries) against T2 bands of 20-40 and 20-70 percent from vendor and legal guides. Treat the median as the floor test and the bands as what well-run venues reach - then build your own from ticket, utilisation and cost tier, because no indoor-specific margin figure exists in the public record.
Anywhere from one to five years in the published claims, which is why the claims are nearly useless without their assumptions. Our first-party bands, each tied to a configuration: 6-12 months for a compact nine-hole 300 m² setup, 9-14 months for the typical indoor reference venue, 18-30 months for a conservative design-heavy build. Every band names its inputs in the guide that produced it.
Our published equipment-and-build tiers run $50-150K for a small configuration, $150-350K for a medium venue, and $350-800K+ for premium builds - the tier depends on hole count, mechanism mix and theming. External start figures of $300K-$1.5M typically include land, build-out and furniture, which is a different object entirely; always establish what a start-cost figure is buying before comparing it.
Indoor trades seasonality for higher fixed costs: outdoor courses carry weather risk and usually land, while indoor venues pay rent or build-out and can programme 12 months. The public data cannot settle it as a single comparison - the industry margin figures are outdoor-weighted and no indoor-specific medians are published. The indoor-specific case has to be built from your own rent, utilisation and cost tier.
It kills models that have no winter row. Seasonality is the most common margin killer named in the external literature, and the operational answer is programming: off-peak price tiers, winter events and group formats, which our winter guide works through. A model that survives December is a model whose winter assumption is a programme rather than zero.
The reported U.S. industry is $441.6M across 919 businesses growing about 0.4 percent over five years - a mature, slow-growing domestic market dominated by outdoor courses. The global facility category is reported separately at $1.48B growing 6.4 percent. Neither figure measures your catchment: saturation is a local question, and the honest test is what the five venues inside a ten-minute drive are charging, filling and repeating.
Send the floor plan, the rent, and the ticket you think your market accepts, and we will run the five questions against those inputs: which cost tier the room belongs to, how many holes the area holds, what the ladder says at your utilisation, how the winter row fills, and which of the published payback bands describes your case with its assumptions intact. If the numbers are still being argued elsewhere, bring the model - we will show you which input it is arguing about.