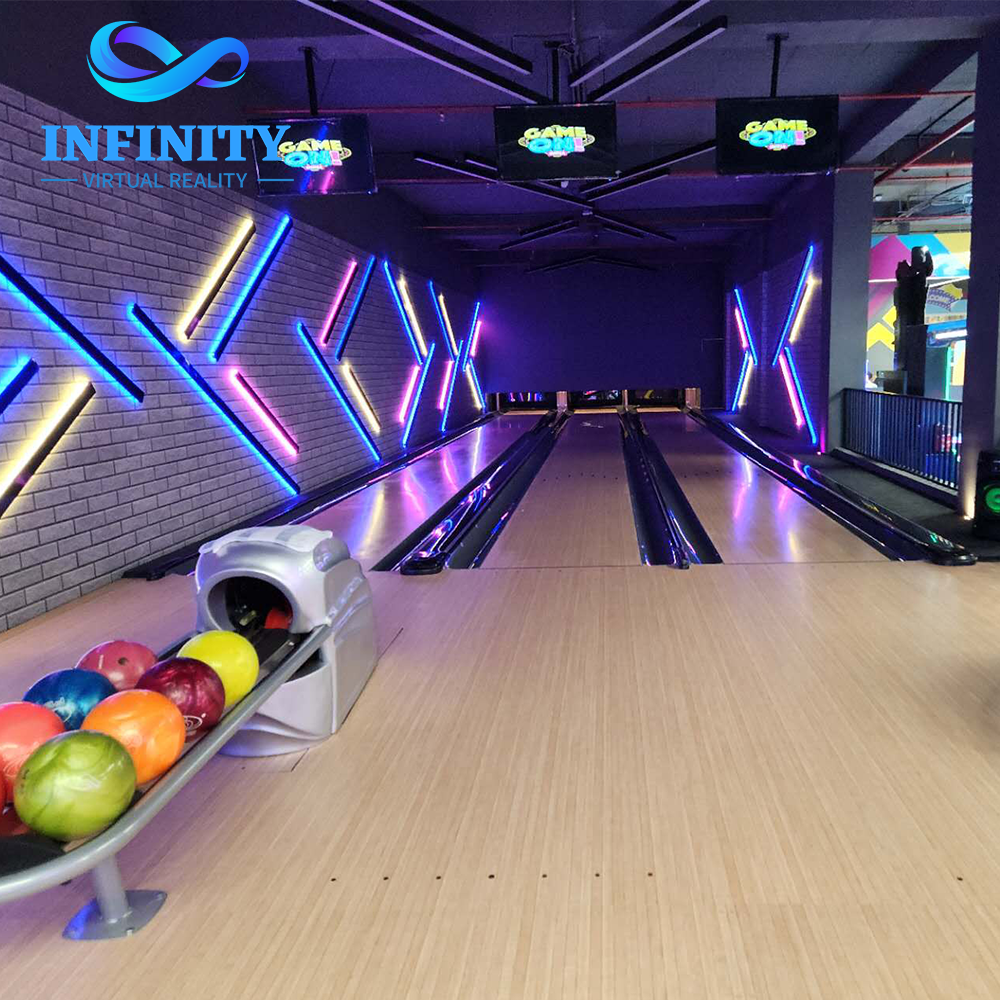
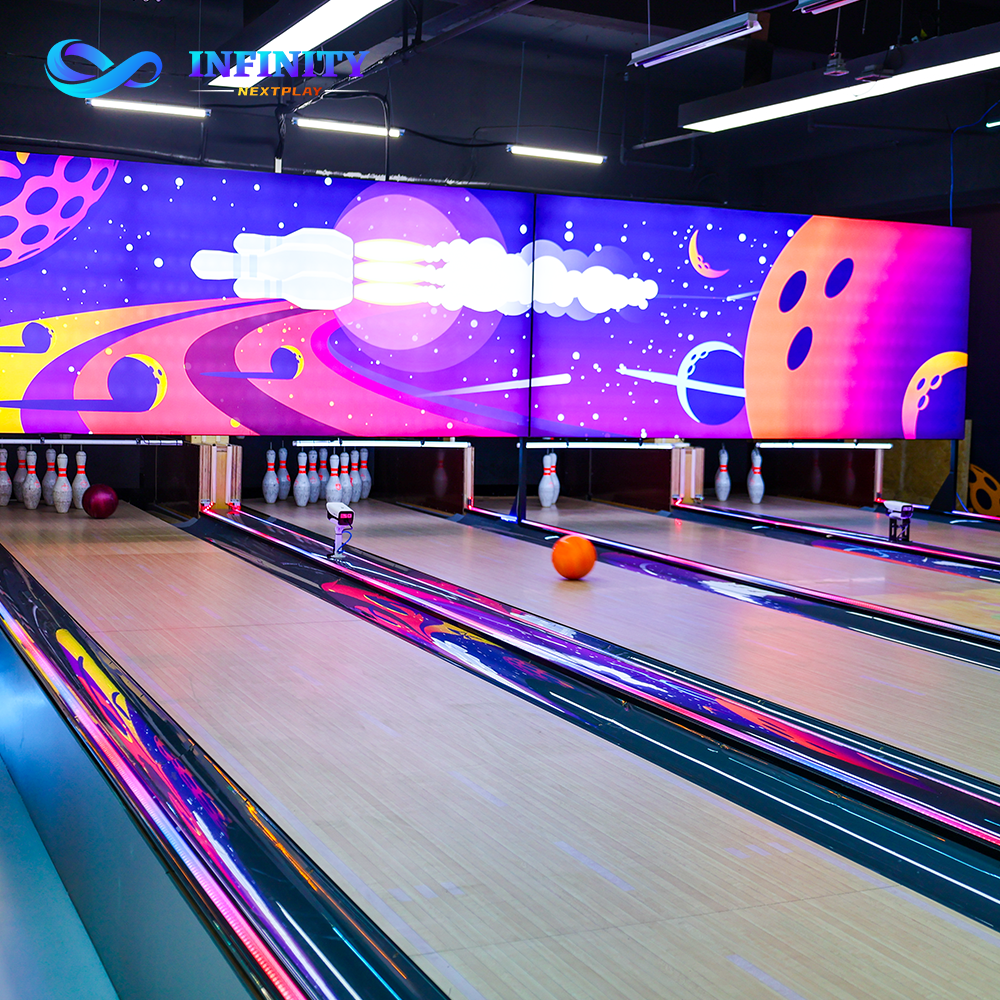
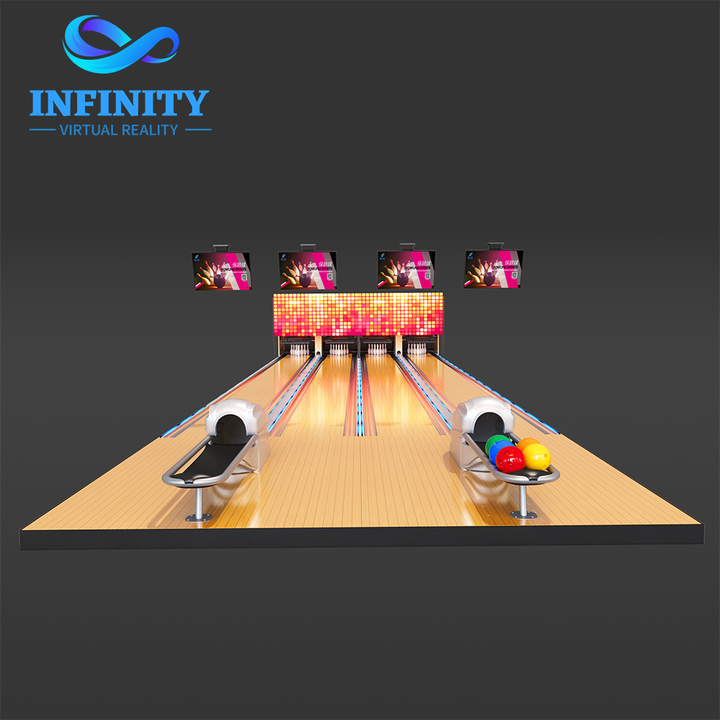
The following equipment units form the primary revenue-generating hardware for the commercial venue described in this guide.
Explore the equipment referenced throughout this guide: Duckpin Bowling System — Full Venue Solution Standard 10-Pin Bowling Alley — Full Venue Solution Commercial 2-Lane String Bowling Equipment. Each unit is engineered for commercial-grade reliability and backed by full factory support.
The choice between Duckpin and 10-pin bowling is not a question of which product is better. It is a question of which business model you are operating. Duckpin bowling fits compact, mixed-attraction venues: family entertainment centers, bars, hotels, boutique venues, and social entertainment spaces that pair bowling with F&B and secondary attractions. A smaller ball and shorter lane mean faster game turnover, a smaller footprint, and lower capital per lane. 10-pin bowling fits bowling-first business models: dedicated bowling centers, large sports venues, league-driven clubs, and competitive environments where bowling is the primary anchor and customers expect a full regulation experience. Assumption: the comparison below models a 4-lane installation under identical operating conditions — 12 operating hours per day, 26 operating days per month, and a steady-state utilization rate of 40%.
Business Models: Duckpin → FEC / mixed-attraction / compact / social / family; 10-Pin → dedicated centers / large venues / league / competitive / bowling-first
Floor space is the most expensive resource in any entertainment venue, so the right metric is not revenue per lane — it is revenue per square meter. Assumption: a Duckpin lane occupies approximately 28m2 including seating and its share of back-of-house. A 10-pin lane occupies approximately 65m2 including the approach, regulation lane, pinsetter room, and seating. A 10-pin lane needs more than twice the footprint of a Duckpin lane. Formula: Revenue per m2 = Monthly Bowling Revenue / Bowling Area. Applying the revenue model from the next sections: Duckpin generates about $134 per m2 per month versus $86 per m2 for 10-pin. Duckpin delivers roughly 55% more revenue from the same floor area. Limitation: footprint figures are planning-level estimates. Confirm exact dimensions with your vendor based on lane count, ceiling height, and local building codes.
Space Model: Duckpin ~28m2/lane vs 10-Pin ~65m2/lane; Revenue per m2 = Monthly Revenue / Bowling Area = $134 vs $86
The investment difference matters most when capital is limited or when you are fitting multiple lanes into a fixed budget. Assumption: per-lane totals include the lane system, pinsetter, ball return, scoring, seating, installation, shipping, electrical, and fit-out. Result: a Duckpin lane typically lands between $25K and $35K all-in. A regulation 10-pin lane typically lands between $50K and $70K all-in. At the mid-point, a 4-lane Duckpin installation is approximately $120K versus approximately $240K for 4 regulation 10-pin lanes. Limitation: these are planning-level project estimates, not quotations. Actual pricing depends on configuration, ceiling height, country of delivery, and local construction costs. Exclusions include lease/deposit, permits, taxes and duties, and architectural fees unless specified in a quotation.
Investment per Lane: Duckpin $25K-$35K (equipment + install + fit-out) vs 10-Pin $50K-$70K; 4-lane midpoint $120K vs $240K
Do not compare ticket price alone — compare revenue generated by the entire lane footprint. Formula: Bowling Revenue = Lanes x Sessions per Hour x Average Price x Operating Hours x Operating Days x Utilization. Assumption: Duckpin averages $30 per lane-hour and 10-pin averages $45 per lane-hour, reflecting the longer, premium session of regulation bowling. Both operate 12 hours per day, 26 days per month, at 40% utilization. Result: a single Duckpin lane generates about $3.7K per month ($30 x 12 x 26 x 0.40), while a single 10-pin lane generates about $5.6K per month ($45 x 12 x 26 x 0.40). Per lane, 10-pin earns more. Per square meter, Duckpin earns more — because two Duckpin lanes fit in the footprint of one 10-pin lane. Limitation: prices are illustrative and vary by market, daypart, and event structure. A venue running leagues will outperform these steady-state figures.
Revenue Formula: Lanes x Sessions/Hr x Avg Price x Hours x Days x Utilization; Duckpin $30/lane-hr = ~$3.7K/lane/mo; 10-Pin $45/lane-hr = ~$5.6K/lane/mo
Bowling''s real commercial value is not the lane fee — it is dwell time. The longer guests stay, the more they spend on drinks, food, birthday parties, corporate events, and secondary attractions like arcade games, darts, or VR. Formula: Total Customer Value = Bowling Spend + F&B Spend + Secondary Attraction Spend + Event Spend. Result: both formats create strong F&B opportunity because both hold groups for 45 to 90 minutes. The difference is structure: Duckpin''s shorter games create faster table turnover and more impulse purchases, while 10-pin''s longer regulation games extend dwell time per group and support larger bar tabs per visit. A mixed-attraction Duckpin venue can stack four to six revenue sources (bowling, F&B, arcade, darts, VR, events) against the one or two sources of a bowling-only 10-pin center. Limitation: F&B and secondary-spend figures depend heavily on layout, service speed, and how deliberately the venue merchandises food and drink to players. Dwell time does not convert to spend automatically.
Total Customer Value = Bowling + F&B + Secondary Attractions + Events; Duckpin = faster turnover + more impulse; 10-Pin = longer dwell + larger bar tabs
Revenue alone does not decide payback — cumulative operating cash flow does. Cash flow is what remains after operating costs, and it is the number that pays back the initial investment. Assumption: a 4-lane Duckpin venue generates about $15.0K in monthly revenue with $6.5K in operating costs, producing $8.5K in monthly operating cash flow. A 4-lane 10-pin venue generates about $22.5K in monthly revenue with $9.5K in operating costs, producing $13.0K in monthly operating cash flow. Result at 18 months: Duckpin has recovered its $120K investment and is about $33K ahead (minus $120K plus $8.5K x 18). The 10-pin venue, despite higher monthly revenue, is still about $6K behind at month 18 (minus $240K plus $13.0K x 18) because it started with twice the capital. Limitation: this model is illustrative and is not a guaranteed financial forecast. Actual results depend on local pricing, traffic, utilization, operating costs, and project investment.
18-Month Model: Duckpin 4-lane = -$120K + $8.5K x 18 = ~+$33K; 10-Pin 4-lane = -$240K + $13.0K x 18 = ~-$6K
Payback is calculated from project investment against operating cash flow, not gross revenue. Formula: Payback (months) = Total Investment / Monthly Operating Cash Flow. Duckpin: $120K / $8.5K = approximately 14 months. 10-Pin: $240K / $13.0K = approximately 18.5 months. Under these assumptions, Duckpin reaches payback earlier because its lower space requirement and lower investment allow the venue to generate comparable cash flow with less capital tied up. The conclusion is not that Duckpin is more profitable — it is that Duckpin recovers capital faster under equal utilization. Limitation: payback is a planning-level estimate. It excludes venue lease, general overhead, marketing, and financing costs, and it assumes the venue reaches 40% utilization quickly rather than after a slow ramp-up.
Payback Formula: Investment / Monthly Cash Flow; Duckpin $120K/$8.5K = ~14 mo; 10-Pin $240K/$13.0K = ~18.5 mo
Faster payback does not equal higher lifetime profit — this is the insight most comparison articles miss. Result: after both venues clear their investment, the higher absolute cash flow of 10-pin begins to compound. At 36 months, the Duckpin venue has accumulated about $186K in net cash flow (minus $120K plus $8.5K x 36), while the 10-pin venue has accumulated about $228K (minus $240K plus $13.0K x 36). The crossover point is roughly 27 months. Before 27 months, Duckpin leads. After 27 months, a 10-pin venue that maintains high utilization generates higher lifetime cash flow. Conclusion: choose Duckpin when capital recovery speed and space efficiency matter most; choose 10-pin when you can fund the larger upfront investment and want the higher long-term ceiling. Limitation: the crossover depends entirely on sustained utilization. A 10-pin venue that cannot hold 40% utilization will not overtake Duckpin.
Long-Term Model: crossover ~27 months; 36-month cumulative Duckpin ~+$186K vs 10-Pin ~+$228K; faster payback != higher lifetime profit
Use this decision matrix as a starting point rather than a rule. The right format follows your venue type, audience, and budget. Under 1,000m2: Duckpin. Mixed-attraction FEC: Duckpin. Bowling-first venue: 10-Pin. Large footprint: 10-Pin. Family entertainment: Duckpin. League and competitive bowling: 10-Pin. Premium social entertainment: Duckpin. Limited initial capital: Duckpin. Limitation: these recommendations assume a single primary bowling anchor. Many venues succeed with a hybrid — a small Duckpin bank plus other attractions, or a 10-pin center that adds a Duckpin zone for families.
Decision Matrix: <1000m2=FEC/family/social/limited-capital → Duckpin; bowling-first/large/league → 10-Pin
This is the differentiator that matters for a complete entertainment venue solution. Model A — Mixed FEC: 4 Duckpin lanes plus VR, darts, F&B, and interactive games. This stack spreads revenue across four to six sources, broadens the audience to families and casual groups, and keeps space flexible. Model B — Bowling Center: 8 10-pin lanes plus F&B. This stack concentrates revenue in one to two sources and serves a bowling-focused audience, but requires roughly three times the space of Model A and far more capital. Result: Model A reaches payback faster and is less sensitive to a slow bowling day, because other attractions keep the venue earning. Model B has a higher absolute revenue ceiling when bowling demand is consistently strong. Limitation: the mixed model requires operators to manage more revenue streams and more equipment categories. The bowling-only model is simpler to operate but carries more concentration risk.
Model Comparison: Mixed FEC = 4-6 revenue sources / broader audience / flexible space; Bowling Center = 1-2 sources / bowling-focused / simpler but concentrated
Answer these five questions in order, and the right format usually reveals itself. 1. What is your total usable floor area? Under roughly 1,000m2, Duckpin wins on footprint. 2. Is bowling the anchor or one attraction among several? If it is one of several, Duckpin. If it is the anchor, 10-pin. 3. Who is your core audience? Families, casual groups, and social visitors favor Duckpin. League and competitive bowlers favor 10-pin. 4. How much capital can you deploy up front? Limited capital favors Duckpin''s lower per-lane investment. 5. What is your target payback window? If you need capital back within roughly 15 months, Duckpin''s model is more forgiving. Limitation: this framework is a planning aid, not a financial guarantee. Validate your local market before committing.
5-Question Framework: Floor area → Anchor vs secondary → Audience → Upfront capital → Payback target
Every venue is different. The right bowling format depends on your floor plan, target audience, local pricing, expected traffic, and attraction mix — not on a generic winner. Send us your floor plan or venue dimensions and our team will recommend the correct format, lane count, and companion attractions for your space. This is the fastest way to turn a floor-plan question into a concrete, costed layout.
Next Step: Send floor plan or venue dimensions → format + lane count + attraction mix recommendation → free 3D layout
Not in absolute terms. Per lane, 10-pin generates more revenue ($45 vs $30 per lane-hour in our model). But per square meter, Duckpin earns about 55% more ($134 vs $86 per m2 per month) because two Duckpin lanes fit in the footprint of one 10-pin lane. The right question is which format fits your space and business model.
Yes. A Duckpin lane occupies roughly 28m2 including seating and back-of-house share, versus roughly 65m2 for a regulation 10-pin lane. That is more than a 2x footprint difference per lane.
As a planning estimate, $25K to $35K per lane all-in, including the lane system, pinsetter, ball return, scoring, seating, installation, shipping, electrical, and fit-out. Confirm exact pricing with your vendor.
As a planning estimate, $50K to $70K per lane all-in for a regulation lane. String-pinsetter 10-pin alternatives can reduce both capital and maintenance for budget-conscious operators.
At roughly 65m2 per regulation lane, a 10-pin center fits about 8 to 10 lanes in a 1,000m2 venue after circulation and back-of-house. The same space fits roughly 20+ Duckpin lanes, or a smaller Duckpin bank plus several other attractions.
Generally yes. Duckpin''s compact footprint, faster game turnover, family-friendly format, and lower per-lane investment make it a strong anchor for a mixed-attraction FEC that also runs arcade, darts, VR, and F&B.
In our illustrative 4-lane model at 40% utilization, Duckpin breaks even in about 14 months and 10-pin in about 18.5 months. These are planning estimates, not guarantees — actual results depend on pricing, traffic, utilization, operating costs, and investment.
Yes, and that is exactly where Duckpin shines. Pairing a Duckpin bank with VR, darts, and F&B spreads revenue across multiple sources, broadens the audience, and reduces the venue''s dependence on any single attraction.
| Metric | Duckpin Bowling | 10-Pin Bowling |
|---|---|---|
| Footprint per lane | ~28 m2 | ~65 m2 |
| Investment per lane (all-in) | $25K-$35K | $50K-$70K |
| Average lane-hour price | $28-$38 | $40-$55 |
| Revenue per lane / month | ~$3.7K | ~$5.6K |
| Revenue per m2 / month | ~$134 | ~$86 |
| 4-lane monthly revenue | ~$15.0K | ~$22.5K |
| 4-lane investment (mid) | ~$120K | ~$240K |
| Operating cash flow (4 lanes) | ~$8.5K/mo | ~$13.0K/mo |
| Illustrative payback | ~14 months | ~18.5 months |
| Cumulative at 18 months | ~+$33K | ~-$6K |
| Best for | FEC / compact venues | Large bowling centers |
Send us your floor plan or venue dimensions. Our team will recommend the right bowling format, lane count and attraction mix for your space — free of charge.