The following equipment units form the primary revenue-generating hardware for the commercial venue described in this guide.
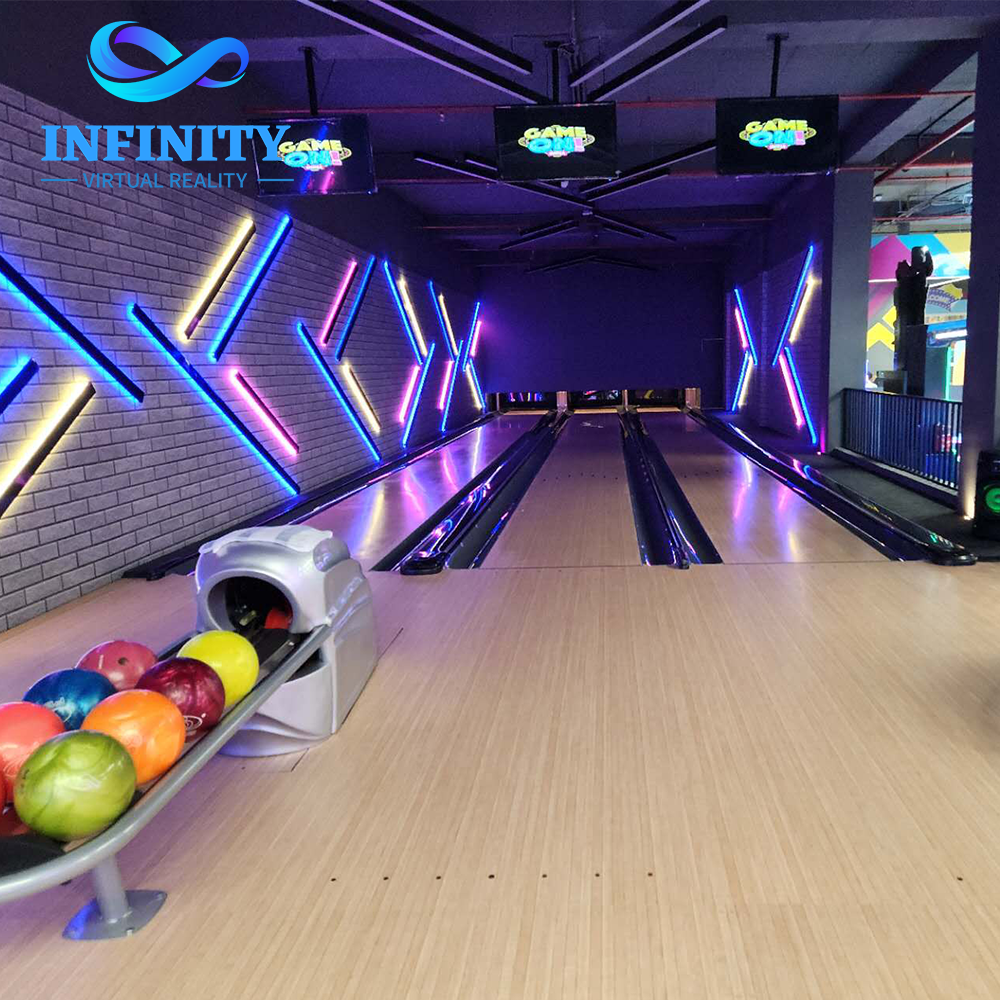
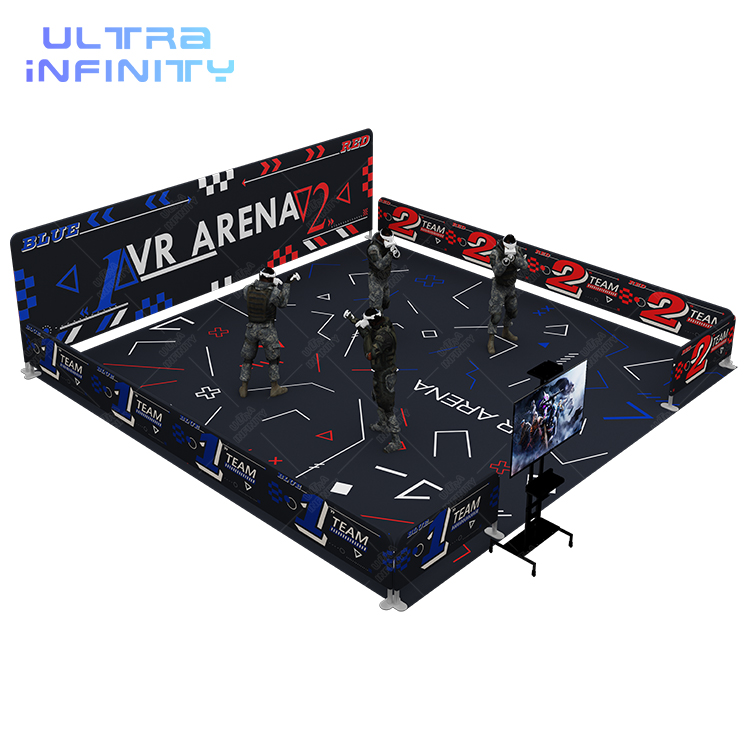
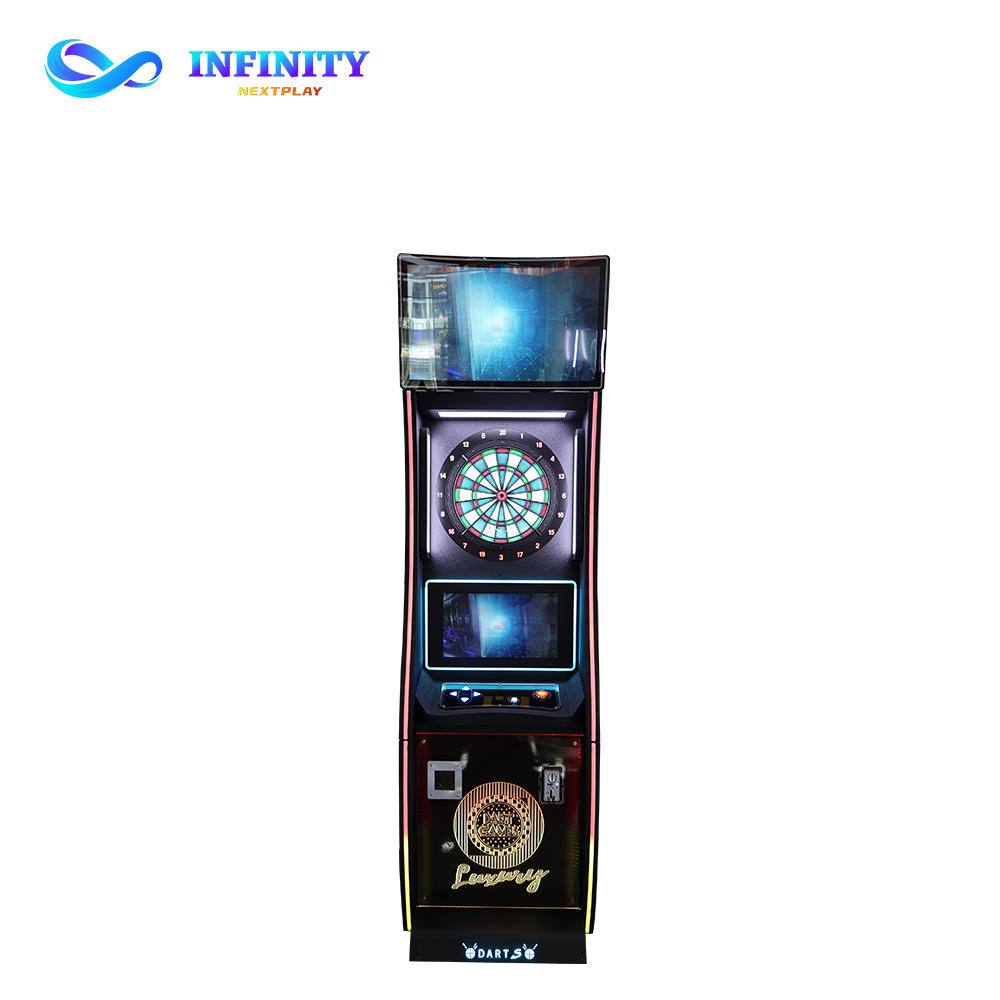
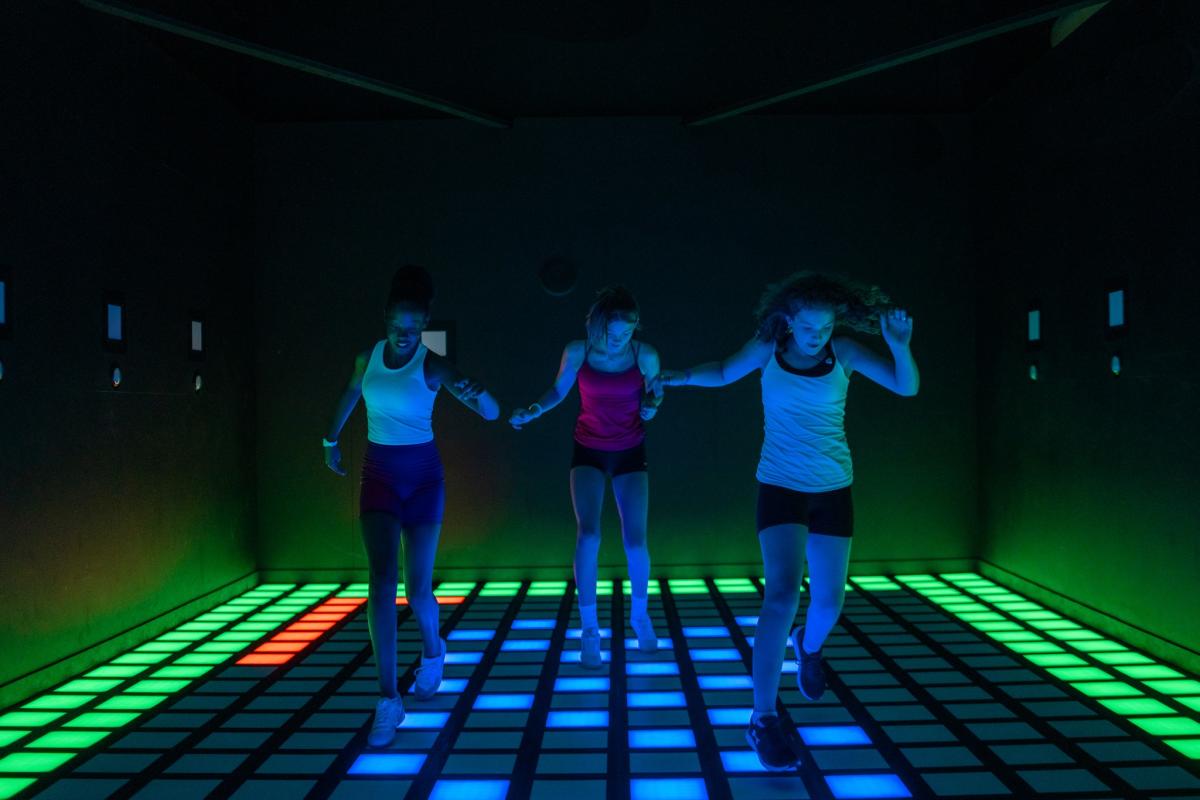
Explore the equipment referenced throughout this guide: Duckpin Bowling System Free Roaming VR Arena 2.0 Online Electronic Dart Machine X7 Interactive LED Floor. Each unit is engineered for commercial-grade reliability and backed by full factory support.
The most common question from first-time entertainment center investors is also the hardest to answer with a single number. An indoor entertainment center in a 300 m² retail unit with arcade machines and a snack counter costs a fraction of what a 2,000 m² multi-attraction venue with bowling, VR, sports simulators, full F&B and event spaces costs.
What makes the question difficult is not the equipment price — it is that most investors enter the planning process thinking about the cost of individual machines rather than the total project investment. The purchase price of a duckpin bowling system or a VR Arena is the most visible cost, but it represents only 35–50% of what it actually takes to open the doors to paying customers.
The Total Project Cost Formula:
Total Project Investment = Attraction Equipment + Interior Fit-Out + Electrical/HVAC/Safety + Shipping & Installation + Furniture/POS/IT + Pre-Opening Costs + Contingency
This article breaks down each category, provides illustrative planning ranges for different venue sizes and business models, and explains where the smart money goes — and where it does not.
Disclaimer: All cost figures, budget ranges and investment examples in this article are illustrative planning estimates based on common operating parameters and NextPlay project experience. They are not quotations. Actual costs vary by location, building condition, local construction labor, shipping distance, customs duties, equipment selection and project scope.
Total Project Investment = Equipment + Fit-Out + MEP + Shipping/Install + Furniture/IT + Pre-Opening + Contingency; Equipment alone = 35-50% of total
Before discussing specific numbers, it is essential to understand the categories that make up a full entertainment center project budget. Missing even one category can produce a planning estimate that is 30–50% below the real cost of opening.
| Cost Category | Typical Share of Budget | What It Covers |
|---|---|---|
| Attractions & Equipment | 35–50% | Bowling, VR, simulators, darts, arcade, interactive floor, party equipment |
| Interior Fit-Out | 15–25% | Flooring, walls, ceiling, lighting, themed décor, signage, reception desk |
| Electrical / HVAC / Safety | 8–15% | Power distribution, climate control, ventilation, fire protection, CCTV |
| Shipping & Installation | 5–12% | Ocean freight, inland transport, customs, assembly, calibration, testing |
| Furniture / POS / IT | 3–8% | Seating, counters, POS system, network, audio, lockers, F&B equipment |
| Pre-Opening & Marketing | 3–7% | Staff recruitment, training, soft opening, launch marketing, website |
| Contingency | 5–10% | Unforeseen costs, price adjustments, schedule overruns, last-minute changes |
The most common budgeting error in entertainment center planning is focusing exclusively on the first row — attraction equipment — and treating the remaining 50–65% as an afterthought. This is why experienced investors request a total project estimate, not an equipment price list.
Note: These percentage ranges are illustrative planning guidelines. The actual split depends on building condition, local construction costs and the complexity of the attraction mix.
Attraction equipment is the most visible cost and typically the largest single line item in the budget. But equipment pricing is not a simple per-unit number — it varies by configuration, lane count, game library, branding requirements and whether the equipment is purchased as part of a full-service project or as standalone units.
Instead of listing individual equipment prices (which depend on project-specific factors), it is more useful to think about attractions in three investment tiers:
Anchor attractions are the primary reason customers visit. They consume the largest footprint and the largest share of the equipment budget. They also drive the longest dwell times and the highest per-customer revenue.
• Duckpin Bowling (4–8 lanes) — Compact, higher session turnover than 10-pin. Suitable for FECs, bars and mixed-attraction venues. Equipment investment varies by lane count and scoring system.
• 10-Pin Bowling (4–12 lanes) — International standard, larger footprint per lane. Suitable for dedicated bowling centers and large multi-attraction venues.
• Free Roaming VR Arena (100–300 m²) — Multiplayer immersive experience. Investment depends on arena size, number of simultaneous players and game library. Highest revenue-per-m² potential among anchor attractions.
• Indoor Mini Golf (300–800 m²) — Themed holes, modular design. Lower per-m² equipment cost than bowling or VR, but requires significant themed fit-out.
Planning principle: A profitable venue typically anchors on 1–2 of these attractions and surrounds them with secondary and flexible attractions, rather than investing the entire equipment budget in a single anchor.
Secondary attractions fill the space between anchor attractions and social zones. They typically have lower per-unit investment, shorter session times and stronger repeat-play characteristics.
• Digital Shooting Simulator — 4-player competitive shooting with real-time leaderboard. Strong repeat-play driver for adult and teen audiences.
• Indoor Golf Simulator — Professional-grade ball tracking and course play. Attracts corporate clients and league players.
• Baseball Batting Simulator — Real-time ball tracking, competitive scoring. Appeals to sports entertainment venues.
• Digital Archery Simulator — Adjustable track distance, dual-screen scoring. Unique draw in markets where archery is novel.
• Electronic Darts (X3/X4/X5/X7 models) — From coin-operated to online league play. One of the highest revenue-per-m² attractions available. Very low footprint (3–5 m² per unit).
These attractions fit into spaces that cannot accommodate larger equipment — dead corners, waiting areas, corridors, F&B-adjacent zones. Their low per-unit investment makes them ideal for filling budget gaps and activating underutilized square meters.
• Interactive LED Floor — 12–36 tiles, multiple game modes. Converts 20–40 m² of dead space into a revenue-generating activation zone. See our LED Floor Revenue Analysis.
• Arcade Machines — Wide variety, low per-unit cost. Best used as filler attractions rather than primary draw.
• Interactive Sports Games — Grid LED, reaction walls, precision-strike games. Appeal to competitive groups and casual players alike.
The strategic value of this tier is not the individual price per unit but the aggregate effect: every 20 m² of dead space converted to a $6K/month revenue zone increases the venue-wide revenue density without requiring additional lease area.
Interior fit-out is the second-largest cost category in most projects — and the one most frequently underestimated by first-time investors. The same attraction equipment installed in a brand-new shell building versus a fully fitted retail unit can produce a project cost difference of 30–60%.
• Flooring — Different zones require different flooring: rubberized sports flooring for active zones, carpet or vinyl for social areas, non-slip tile for F&B, polished concrete for circulation.
• Walls & Partitions — VR Arenas need enclosed, light-controlled spaces. Bowling areas need sound-dampening partitions. Party rooms need privacy walls.
• Ceiling & Lighting — High ceilings (4–6m minimum for VR Arena and bowling) with zoned lighting: bright in active zones, ambient in social areas, theatrical in immersive zones.
• Themed Décor & Signage — Wall graphics, themed elements, external signage, wayfinding. This is not purely cosmetic — it directly affects the customer''s willingness to pay premium prices.
• Reception, Restrooms & Back-of-House — Reception desk, ticketing area, restroom fit-out, staff areas, storage rooms. Often overlooked in early-stage budgeting.
Key insight: A raw shell space requires significantly more fit-out investment than a previously occupied retail unit. When evaluating potential venues, factor the condition of the building into the total project cost — a cheaper lease on a shell building can end up costing more after fit-out than a higher-rent fitted unit.
This category is invisible to customers but critical to operations. Under-investing here produces ongoing problems: power trips during peak hours, inadequate cooling that drives guests out in summer, fire safety issues that delay opening permits.
• Electrical Infrastructure — Entertainment equipment draws significant power. A VR Arena, bowling pinsetters, multiple simulators and LED displays running simultaneously require dedicated circuits, voltage stabilization and capacity headroom for future expansion. Budget for a professional electrical load calculation before signing a lease.
• HVAC (Heating, Ventilation, Air Conditioning) — A venue with 100+ active guests, multiple heat-generating machines, enclosed VR spaces and a kitchen produces substantial heat load. Inadequate HVAC is one of the most common post-opening complaints in entertainment centers.
• Fire Protection — Sprinkler systems, fire alarms, emergency exits, smoke detection. These are not optional and must meet local code. The cost depends on the building''s existing systems.
• CCTV & Access Control — Security cameras, entry gates, staff access systems. Essential for insurance, liability protection and operational oversight.
Planning rule: Allocate 8–15% of total project budget to MEP (Mechanical, Electrical, Plumbing) systems. In older buildings or buildings without existing infrastructure, this percentage can be higher.
The gap between equipment purchase and revenue generation is filled by shipping, customs clearance, installation, calibration and staff training. These costs are project-specific and depend heavily on geography.
• International Freight — Ocean freight from the manufacturing base to the destination port. Cost depends on container volume, weight and shipping route. A full 40-foot container of entertainment equipment costs more to ship than a partial load, but the per-unit cost is lower.
• Customs & Duties — Import tariffs, customs brokerage fees, port charges. These vary significantly by country. Always confirm duty rates for your specific equipment categories before finalizing a budget.
• Inland Transport — From port to venue. Distance, access constraints and equipment size determine the cost. Large items like bowling lanes may require specialized handling.
• On-Site Installation — Assembly, electrical connection, mechanical calibration, software setup, game library loading, network configuration. This is skilled labor and should not be treated as a DIY cost-saving opportunity — improper installation leads to higher maintenance costs and shorter equipment lifespan.
• Staff Training — Operator training on each attraction, safety procedures, basic troubleshooting, customer service protocols. Well-trained staff reduce equipment downtime and improve customer experience.
Recommendation: Always request a project quotation that clearly separates equipment FOB cost, shipping estimate, and installation cost. A bundled “all-in” number without line-item detail makes it impossible to evaluate whether you are paying appropriately for each component.
This category covers everything customers touch that is not an attraction — and everything staff use to run the business.
• Seating & Tables — F&B seating, lounge furniture, spectator benches, waiting area chairs. Durability matters more than aesthetics in high-traffic entertainment environments.
• Reception & Ticketing Counters — Front desk, ticket kiosks, queue management barriers.
• POS (Point of Sale) System — Hardware terminals, software licenses, payment processing integration, inventory management. A robust POS system that handles attraction credits, F&B orders and membership tracking in a single platform is worth the investment.
• Network & Audio — WiFi for guests, wired network for equipment and POS, zone-based audio system for different venue areas. Many modern attractions require internet connectivity for leaderboards and online play.
• F&B Equipment — Kitchen equipment, bar setup, refrigeration, coffee machine, ice maker. Even a basic F&B operation requires significant equipment investment.
• Lockers & Storage — Customer lockers, coat check, equipment storage, cleaning supply storage.
Planning rule: Furniture, POS and IT typically represent 3–8% of total project cost. The variation depends on F&B ambition (a full kitchen vs. a snack counter) and technology requirements.
These categories are sometimes absent from initial budgets because they do not produce visible assets. But without them, the venue cannot open — and without contingency, unexpected costs derail the entire project.
• Staff Recruitment & Training — Hiring costs, pre-opening payroll, training program development. Plan for 4–8 weeks of staff costs before the first customer arrives.
• Soft Opening Period — Operating at reduced capacity for 2–4 weeks to test systems, train staff under real conditions and gather customer feedback. Revenue during this period is typically low.
• Launch Marketing — Grand opening campaign, social media advertising, local PR, signage, promotional offers. The first 90 days of marketing intensity determine the venue''s initial trajectory.
• Permits & Licenses — Business license, entertainment license, F&B permit, fire safety certificate, building occupancy permit. Costs vary by jurisdiction.
• Working Capital Reserve — Cash buffer for the first 3–6 months of operations while revenue ramps up to steady-state levels. This is not a project cost per se, but it is essential for financial stability.
• Contingency (5–10% of total budget) — No project goes exactly to plan. Construction delays, equipment damage in transit, unexpected building issues, last-minute scope changes. A project without contingency is a project that will run out of money before opening.
Recommendation: If your budget is tight, protect the contingency line. Cutting contingency to reduce the headline number creates a budget that looks good on paper but cannot survive contact with reality.
The following scenarios illustrate how total project investment scales with venue size. These are planning-level estimates based on common multi-attraction configurations. Actual costs vary by location, building condition, equipment selection and local labor rates.
| Venue Size | Typical Concept | Attraction Count | Illustrative Total Investment |
|---|---|---|---|
| 200–400 m² | Compact Entertainment Zone | 3–5 | $120K–$250K |
| 500–800 m² | Family FEC / Sportainment | 5–8 | $250K–$450K |
| 1,000–1,500 m² | Multi-Attraction Venue | 8–12 | $435K–$750K |
| 2,000–3,000 m² | Large Entertainment Center | 12–18 | $750K–$1.5M |
| 3,000 m²+ | Destination Entertainment Park | 18+ | $1.5M+ |
Important: The relationship between venue size and investment is not linear. A 1,000 m² venue does not cost exactly twice as much as a 500 m² venue because certain costs (project management, design, some infrastructure) do not scale proportionally. The investment-per-m² typically decreases as venue size increases, because fixed costs are amortized over a larger area.
Disclaimer: These investment ranges are illustrative planning scenarios, not quotations. They assume a mid-range fit-out in a building with basic existing infrastructure. Actual costs vary by location, building condition and project scope.
Venue Size vs Investment: 200-400m2 = $120K-$250K | 500-800m2 = $250K-$450K | 1000-1500m2 = $435K-$750K | 2000-3000m2 = $750K-$1.5M | 3000m2+ = $1.5M+
Two venues of identical size can have dramatically different project costs depending on the entertainment concept. The attraction mix is the primary cost driver, followed by fit-out requirements and infrastructure needs.
| Concept (1,000 m²) | Typical Attractions | Illustrative Equipment Budget | Illustrative Total Project |
|---|---|---|---|
| Family FEC | Soft play + mini golf + VR + arcade + party rooms + small F&B | $150K–$250K | $300K–$480K |
| Sports Entertainment | Bowling + golf sim + baseball + darts + shooting + sports bar | $220K–$380K | $400K–$650K |
| VR-First | VR Arena + VR racing + VR shooting + VR flight + small F&B | $180K–$300K | $300K–$500K |
| Premium Multi-Attraction | Bowling + VR Arena + simulators + interactive floor + darts + shooting + full F&B + event space | $280K–$450K | $500K–$850K |
The investment differences between these concepts are driven by:
• Equipment density — A VR-first venue has fewer but more expensive individual units. A Sports Entertainment venue has more units at moderate per-unit cost.
• Fit-out requirements — Bowling requires specific flooring and lane construction. VR Arena requires light-controlled, enclosed spaces. F&B requires kitchen infrastructure.
• Infrastructure demands — More electronic equipment means more electrical capacity, more cooling and more network infrastructure.
Disclaimer: These are illustrative planning scenarios. Actual costs depend on equipment configuration, building condition, local construction costs and project-specific requirements.
Cost per m² is a commonly used shorthand for comparing projects, but it should be understood as a rough planning metric, not a precision tool. Two venues of identical size can have dramatically different cost-per-m² figures because the attraction mix drives cost more than floor area does.
Illustrative Investment per m² Ranges:
• Compact entertainment zone (200–400 m²): $600–$800/m²
• Family FEC (500–1,000 m²): $450–$650/m²
• Multi-Attraction Venue (1,000–2,000 m²): $400–$550/m²
• Large Entertainment Center (2,000 m²+): $350–$500/m²
The reason cost per m² decreases with venue size is that certain fixed costs (project management, design fees, core infrastructure) are spread over a larger area. However, this metric says nothing about revenue. A venue with $400/m² investment that generates $200/m²/month in revenue is a better investment than a venue with $300/m² investment generating $80/m²/month.
Planning principle: Use cost per m² to sanity-check your budget against comparable projects. Do not use it as the primary decision metric. Revenue per m² matters more.
Budget allocation is as important as the total number. Spending more in the right categories improves the customer experience, reduces long-term operating costs and accelerates payback. Spending more in the wrong categories increases the investment without improving the return.
Spend More Here:
• Electrical Infrastructure — Under-specced electrical systems cause recurring downtime. Build in 20–30% capacity headroom for future expansion.
• HVAC — An uncomfortable venue loses customers in summer and winter. This is not a cost to minimize — it is a customer retention investment.
• Anchor Attraction Quality — The primary draw should not be the cheapest version available. A bowling system with frequent mechanical issues or a VR Arena with outdated graphics damages the venue''s reputation.
• Professional Installation — Improperly installed equipment generates higher maintenance costs over its entire lifespan. The installation saving today becomes a repair cost every month.
• Fire & Safety Systems — This is non-negotiable. Delays in obtaining fire safety certification can postpone opening by weeks or months.
Potential Savings Areas:
• Phased Investment — Open with a core attraction set, then add secondary attractions in months 6–12 using operating cash flow. Reduces upfront capital requirement.
• Modular Attractions — Choose equipment that can be reconfigured or relocated within the venue. Avoid permanently built-in attractions that cannot be changed if the mix needs adjustment.
• Standard Finishes in Non-Customer Areas — Back-of-house corridors, storage rooms and staff areas do not need premium finishes. Save the budget for customer-facing zones.
• Flexible F&B Setup — Start with a streamlined menu and counter-service model. Expand to a full kitchen later based on actual demand data, not pre-opening assumptions.
A limited budget does not mean a non-viable venue. It means the attraction mix must be designed around revenue density rather than footprint, and every square meter must earn its place in the budget.
Strategy for a $150K–$250K Equipment Budget:
• Anchor on one high-density attraction: a compact VR Arena or a 4-lane duckpin bowling system, not both.
• Fill the remaining space with low-footprint, high-margin attractions: electronic darts (multiple units, 3–5 m² each), interactive LED floor (20–30 m²), digital shooting simulator.
• Start with a counter-service F&B model — coffee, soft drinks, packaged snacks. Add a proper kitchen in phase 2.
• Use the same space for multiple functions: the party room doubles as an event space; the LED floor zone serves as a waiting area between sessions.
Strategy for a $300K–$500K Equipment Budget:
• Include two complementary anchor attractions: duckpin bowling (4–6 lanes) + compact VR Arena.
• Add sports simulators (golf + baseball), darts (multiple units) and interactive floor for a diversified mix.
• Invest in a proper F&B zone with prepared food capability.
• Allocate space and budget for a dedicated party/event room.
Universal Principle for Limited Budgets:
Do not try to fill every square meter on day one. An 800 m² venue with 600 m² of well-designed attraction space and 200 m² reserved for phase 2 expansion is a better investment than an 800 m² venue with 800 m² of under-invested, mediocre attractions.
The cheapest project is not necessarily the most profitable. A higher upfront investment, if allocated correctly, can produce higher revenue density, faster payback and stronger long-term returns. The relationship between investment and return is determined by revenue per m², not by the total budget number.
Illustrative Comparison — 1,000 m² Venue:
| Scenario | Total Investment | Monthly Revenue | Revenue/m² | Monthly Cash Flow | Payback |
|---|---|---|---|---|---|
| Budget-Focused | $350K | $80K | $80/m² | $24K | ~15 months |
| Balanced | $550K | $147K | $147/m² | $45K | ~12 months |
| Premium | $850K | $210K | $210/m² | $63K | ~13.5 months |
Key insight: The Balanced scenario (mid-range investment) produces the fastest payback despite not being the cheapest. The Budget scenario''s lower investment is offset by lower revenue density, producing a longer payback period. The Premium scenario generates the highest absolute returns but requires more capital and takes slightly longer to recoup.
The driver of this dynamic is revenue per m². See our FEC Business Planning Guide for a complete revenue model framework.
Disclaimer: This is an illustrative comparison model using planning assumptions, not a guaranteed financial forecast. Actual results depend on local market conditions, pricing, traffic and operational execution. Payback is calculated from estimated total project investment against monthly operating cash flow (gross revenue minus direct operating costs at 65–75% cost ratio).
3 scenarios: Budget $350K/$80K/15mo | Balanced $550K/$147K/12mo | Premium $850K/$210K/13.5mo; Payback = Investment / Operating Cash Flow
Before requesting a project quotation, gather the following information. The more complete the inputs, the more accurate the budget estimate will be.
• Venue size and dimensions — Total m², ceiling height, column grid, available floor plan
• Building condition — Shell/core or previously fitted? Existing electrical capacity? Existing HVAC?
• Target audience — Families, adults, teens, mixed, corporate
• Business model — FEC, sports entertainment, VR-first, multi-attraction
• Desired attraction types — Bowling, VR Arena, sports simulators, interactive floor, darts, arcade, mini golf
• F&B ambition — Counter service only, full kitchen, bar/lounge
• Event space requirements — Number of party rooms, dedicated event hall, flexible multi-use space
• Shipping destination — Country, nearest port, inland distance
• Timeline — Target opening date, any seasonal constraints
• Budget range — Total available budget, any phasing preferences
Providing this information with your initial inquiry allows a solution provider to prepare a planning-level budget that reflects your specific project rather than a generic industry average.
Every entertainment center project is different. Venue size, location, building condition, target audience and attraction mix all affect the total investment. A generic budget range from an article is a starting point — a project-specific estimate based on your floor plan and requirements is a decision-making tool.
NextPlay provides concept design, 3D layout, attraction planning, equipment supply and installation support for multi-attraction entertainment venues worldwide. Our project portfolio spans 30+ installations across Asia, Europe, the Middle East and the Americas.
Send us your venue dimensions, target attractions and project goals. Our team can prepare a planning-level budget estimate and 3D layout concept for your project.
A multi-attraction indoor entertainment center of 1,000 m² typically requires a total project investment of $435K–$750K, covering attraction equipment, interior fit-out, electrical/HVAC, shipping/installation, furniture/POS/IT, pre-opening costs and contingency. Smaller venues (200–500 m²) can start in the $120K–$250K range. These are planning-level estimates, not quotations. Actual costs vary by location, building condition and equipment selection.
Attraction equipment typically represents 35–50% of the total project investment. For a 1,000 m² multi-attraction venue, the equipment budget typically ranges from $250K–$450K depending on the mix. Anchor attractions (bowling, VR Arena) are the largest individual line items. Secondary attractions (darts, shooting, golf simulator) are moderate-cost per unit. Flexible attractions (LED floor, arcade) are the lowest per-unit cost. A complete equipment cost depends on the specific configuration, lane/bay count and game library.
A 1,000 m² multi-attraction FEC with bowling, VR Arena, sports simulators, darts, interactive floor, F&B and party rooms typically requires a total project investment of $435K–$750K. This includes all seven cost categories: equipment, fit-out, MEP, shipping/installation, furniture/POS/IT, pre-opening costs and contingency. A more focused concept (e.g., VR-first or sports-only) at the same size may fall in the $300K–$500K range.
Attraction equipment is typically the single largest cost category at 35–50% of the total project investment. Within equipment, anchor attractions (bowling systems and VR Arenas) are the largest individual items. However, the combined cost of interior fit-out, electrical/HVAC and installation frequently equals or exceeds the equipment cost. This is why total project cost, not equipment price, should be the primary budget metric.
Illustrative investment per m² ranges from $350–$800/m² depending on venue size and concept. Smaller venues (200–400 m²) tend toward the higher end ($600–$800/m²) because fixed costs are spread over less area. Larger venues (2,000 m²+) tend toward the lower end ($350–$500/m²). However, cost per m² is a rough planning metric — the attraction mix drives cost more than floor area does. Two 1,000 m² venues can have investment-per-m² figures that differ by 40–60%.
For planning purposes, allocate 35–50% of your total project budget to attraction equipment. The remaining 50–65% covers fit-out, infrastructure, shipping, installation, furniture, technology, pre-opening and contingency. A common mistake is allocating 70–80% of the budget to equipment and running out of funds before the venue is ready to open. Build the budget from total project cost, not equipment wish-list.
Under illustrative planning assumptions, a well-designed 1,000 m² multi-attraction venue with a $550K total project investment and $45K/month operating cash flow reaches payback in approximately 12–14 months after operational stabilization. This is a planning model, not a guarantee. For a complete analysis, see our FEC Business Planning Guide.
Yes. Send us your venue dimensions, floor plan (if available), target attractions and project goals. Our team can prepare a planning-level budget estimate and 3D layout concept for your specific project. The estimate will include equipment, shipping, installation and fit-out ranges based on your building condition and location. Contact our team to start.
| Venue Size | Typical Concept | Attractions | Equip. Budget | Total Project | Revenue Density |
|---|---|---|---|---|---|
| 200-400 m2 | Compact Zone | 3-5 | $80K-$150K | $120K-$250K | $150-$250/m2/mo |
| 500-800 m2 | FEC / Sportainment | 5-8 | $150K-$280K | $250K-$450K | $120-$180/m2/mo |
| 1,000-1,500 m2 | Multi-Attraction | 8-12 | $250K-$450K | $435K-$750K | $140-$210/m2/mo |
| 2,000-3,000 m2 | Large Center | 12-18 | $400K-$800K | $750K-$1.5M | $120-$200/m2/mo |
| 3,000 m2+ | Destination Park | 18+ | $800K+ | $1.5M+ | $100-$180/m2/mo |
Share your venue size, floor plan, target attractions and location. Our team can prepare a planning-level budget estimate and 3D layout concept for your specific project.